

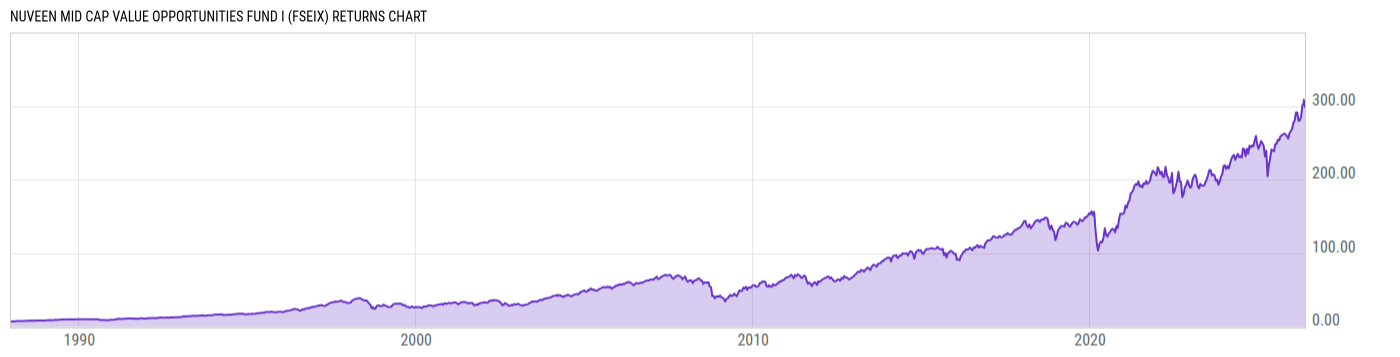
Nuveen Mid Cap Value Opportunities Fund I (FSEIX)
61.58
+0.73
(+1.20%)
USD |
Jun 09 2026
Returns Chart
Key Stats
| Net Expense Ratio | Total Assets Under Management | Weighted Average Dividend Yield | Turnover Ratio (Generic) |
|---|---|---|---|
| 0.88% | 367.60M | 1.68% | 19.00% |
| 1 Year Fund Level Flows | 1 Year Total Returns (Daily) | Annualized Total Returns Since Inception (Daily) | Max Drawdown (Since Inception) |
| -117.80M | 29.85% |
Basic Info
| Investment Strategy | |
| The Fund seeks capital appreciation. The Fund invests at least 80% of the sum of its net assets in equity securities of mid-capitalization value companies, defined as companies that have market capitalization at the time of purchase within the market capitalization range of the companies in the Russell Midcap Index. |
| General | |
| Security Type | Mutual Fund |
| Equity Style | Mid Cap Core |
| Broad Asset Class | US Equity |
| Broad Category | Equity |
| Global Peer Group | Equity US Sm&Mid Cap |
| Peer Group | Mid-Cap Value Funds |
| Global Macro | Equity North America |
| US Macro | Mid-Cap Funds |
| YCharts Categorization | -- |
| YCharts Benchmark | -- |
| Prospectus Objective | Mid-Cap Funds |
| Fund Owner Firm Name | Nuveen |
| Broad Asset Class Benchmark Index | |
| ^SPXTR | 100.0% |
Net Fund Flows Versus Peer Group
1 Month
% Rank:
49
-391.34M
Peer Group Low
324.38M
Peer Group High
1 Year
% Rank:
63
-117.80M
-3.208B
Peer Group Low
1.675B
Peer Group High
3 Months
% Rank:
49
-736.33M
Peer Group Low
1.054B
Peer Group High
3 Years
% Rank:
65
-13.16B
Peer Group Low
2.323B
Peer Group High
6 Months
% Rank:
58
-1.684B
Peer Group Low
1.395B
Peer Group High
5 Years
% Rank:
54
-19.04B
Peer Group Low
2.497B
Peer Group High
YTD
% Rank:
54
-1.134B
Peer Group Low
1.304B
Peer Group High
10 Years
% Rank:
39
-45.09B
Peer Group Low
5.968B
Peer Group High
Date Unavailable
Risk
Performance Versus Peer Group
Annual Total Returns Versus Peers
As of June 10, 2026.
Asset Allocation
As of April 30, 2026.
| Type | % Net |
|---|---|
| Cash | 0.83% |
| Stock | 99.26% |
| Bond | 0.00% |
| Convertible | 0.00% |
| Preferred | 0.00% |
| Other | -0.09% |
Top 10 Holdings
| Name | % Weight | Price | % Change |
|---|---|---|---|
| TD SYNNEX Corp. | 2.94% | 272.80 | 0.38% |
| Digital Realty Trust, Inc. | 2.43% | 184.93 | 1.53% |
| WESCO International, Inc. | 2.33% | 355.30 | 0.59% |
| Dover Corp. | 2.30% | 220.97 | 2.21% |
| L3Harris Technologies, Inc. | 2.30% | 308.17 | 2.01% |
| Ciena Corp. | 2.21% | 439.34 | -5.86% |
| Arch Capital Group Ltd. | 2.14% | 90.41 | 0.89% |
| MKS, Inc. | 2.12% | 320.96 | 2.84% |
| Raymond James Financial, Inc. | 2.11% | 151.37 | 0.79% |
| East West Bancorp, Inc. | 2.04% | 128.66 | 1.90% |
Fees & Availability
| Fees | |
| Actual 12B-1 Fee | -- |
| Actual Management Fee | 0.67% |
| Administration Fee | -- |
| Maximum Front Load | -- |
| Maximum Deferred Load | -- |
| Maximum Redemption Fee | -- |
| General Availability | |
| Available for Insurance Product | No |
| Available for RRSP | No |
| Purchase Details | |
| Open to New Investors |
|
| Minimum Initial Investment | 100000.0 None |
| Minimum Subsequent Investment | 0.00 None |
Basic Info
| Investment Strategy | |
| The Fund seeks capital appreciation. The Fund invests at least 80% of the sum of its net assets in equity securities of mid-capitalization value companies, defined as companies that have market capitalization at the time of purchase within the market capitalization range of the companies in the Russell Midcap Index. |
| General | |
| Security Type | Mutual Fund |
| Equity Style | Mid Cap Core |
| Broad Asset Class | US Equity |
| Broad Category | Equity |
| Global Peer Group | Equity US Sm&Mid Cap |
| Peer Group | Mid-Cap Value Funds |
| Global Macro | Equity North America |
| US Macro | Mid-Cap Funds |
| YCharts Categorization | -- |
| YCharts Benchmark | -- |
| Prospectus Objective | Mid-Cap Funds |
| Fund Owner Firm Name | Nuveen |
| Broad Asset Class Benchmark Index | |
| ^SPXTR | 100.0% |
Fundamentals
| General | |
| Distribution Yield | -- |
| Dividend Yield TTM (6-8-26) | 1.24% |
| 30-Day SEC Yield (5-31-26) | 0.91% |
| 7-Day SEC Yield | -- |
| Number of Holdings | 68 |
| Stock | |
| Weighted Average PE Ratio | 27.48 |
| Weighted Average Price to Sales Ratio | 3.659 |
| Weighted Average Price to Book Ratio | 3.854 |
| Weighted Median ROE | 11.12% |
| Weighted Median ROA | 4.68% |
| ROI (TTM) | 24.79% |
| Return on Investment (TTM) | 24.79% |
| Earning Yield | 0.0503 |
| LT Debt / Shareholders Equity | 0.9266 |
| Number of Equity Holdings | 64 |
As of April 30, 2026
Growth Metrics
| EPS Growth (1Y) | 12.31% |
| EPS Growth (3Y) | 5.67% |
| EPS Growth (5Y) | 18.02% |
| Sales Growth (1Y) | 7.24% |
| Sales Growth (3Y) | 7.25% |
| Sales Growth (5Y) | 10.46% |
| Sales per Share Growth (1Y) | 7.06% |
| Sales per Share Growth (3Y) | 6.53% |
| Operating Cash Flow - Growth Rate (3Y) | 22.19% |
As of April 30, 2026
Fund Details
Top Portfolio Holders
| Name | % Weight |
|---|---|
| Portfolio A | 5.00% |
| Portfolio B | 3.50% |
| Portfolio C | 2.25% |
Excel Add-In Codes
| Name: =YCI("M:FSEIX", "name") |
| Broad Asset Class: =YCI("M:FSEIX", "broad_asset_class") |
| Broad Category: =YCI("M:FSEIX", "broad_category_group") |
| Prospectus Objective: =YCI("M:FSEIX", "prospectus_objective") |
| To find the codes for any of our securities and financial metrics, see our Complete Excel Reference. |