

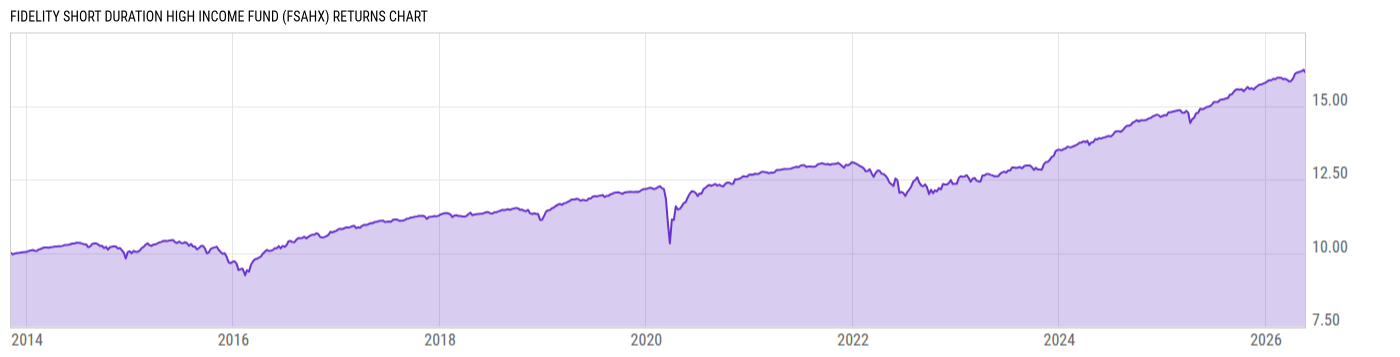
Fidelity Short Duration High Income Fund (FSAHX)
8.99
-0.01
(-0.11%)
USD |
Jun 09 2026
Returns Chart
Key Stats
| Net Expense Ratio | Total Assets Under Management | Weighted Average Dividend Yield | Turnover Ratio (Generic) |
|---|---|---|---|
| 0.73% | 331.81M | -- | 43.00% |
| 1 Year Fund Level Flows | 1 Year Total Returns (Daily) | Annualized Total Returns Since Inception (Daily) | Max Drawdown (Since Inception) |
| 14.80M | 8.39% |
Basic Info
| Investment Strategy | |
| The Fund seeks high level of current income. The Fund may also seek capital appreciation. The Fund will normally invest in income producing debt securities, preferred stocks and convertible securities with an emphasis on lower-quality debt securities. The Fund seeks to maintain an average duration of three years or less. |
| General | |
| Security Type | Mutual Fund |
| Equity Style | -- |
| Broad Asset Class | Taxable Bond |
| Broad Category | Fixed Income |
| Global Peer Group | Bond USD High Yield |
| Peer Group | Short High Yield Funds |
| Global Macro | Bond High Yield |
| US Macro | High Yield Funds |
| YCharts Categorization | -- |
| YCharts Benchmark | -- |
| Prospectus Objective | Short High Yield Funds |
| Fund Owner Firm Name | Fidelity Investments |
| Broad Asset Class Benchmark Index | |
| ^BBUSATR | 100.0% |
Net Fund Flows Versus Peer Group
1 Month
% Rank:
86
-19.58M
Peer Group Low
108.89M
Peer Group High
1 Year
% Rank:
52
14.80M
-186.17M
Peer Group Low
1.374B
Peer Group High
3 Months
% Rank:
31
-374.92M
Peer Group Low
476.36M
Peer Group High
3 Years
% Rank:
90
-428.04M
Peer Group Low
7.937B
Peer Group High
6 Months
% Rank:
34
-600.15M
Peer Group Low
534.52M
Peer Group High
5 Years
% Rank:
42
-918.94M
Peer Group Low
8.753B
Peer Group High
YTD
% Rank:
39
-547.97M
Peer Group Low
495.43M
Peer Group High
10 Years
% Rank:
48
-704.35M
Peer Group Low
8.768B
Peer Group High
Date Unavailable
Risk
Performance Versus Peer Group
Annual Total Returns Versus Peers
As of June 10, 2026.
Asset Allocation
As of March 31, 2026.
| Type | % Net |
|---|---|
| Cash | 1.01% |
| Stock | 0.15% |
| Bond | 98.33% |
| Convertible | 0.00% |
| Preferred | 0.46% |
| Other | 0.05% |
Top 10 Holdings
| Name | % Weight | Price | % Change |
|---|---|---|---|
|
Fidelity Cash Central Fund
|
2.51% | -- | -- |
| TransDigm Inc. TRADIG 6.75 08/15/2028 FIX USD Corporate 144A | 0.76% | 101.17 | -0.01% |
| TENET HEALTHCARE CORPORATION THC 5.125 11/01/2027 FIX USD Corporate | 0.70% | 100.02 | -0.05% |
| CLOUD SOFTWARE GROUP, INC. CLOUDSO 9.0 09/30/2029 FIX USD Corporate 144A | 0.67% | 98.62 | -0.20% |
| EchoStar Corporation ECHO 10.75 11/30/2029 FIX USD Corporate | 0.64% | 108.38 | -0.04% |
| Sotheby's SOTHEB 10/15/2027 FIX USD Corporate 144A (Called) | 0.64% | 100.21 | 0.23% |
| EG Global Finance plc EGGLO 12.0 11/30/2028 FIX USD Corporate 144A | 0.60% | 106.82 | -0.01% |
| APLD COMPUTECO LLC APLDCOM 9.25 12/15/2030 FIX USD Corporate 144A | 0.60% | 107.70 | -0.06% |
| United States of America USGB 3.375 09/15/2028 FIX USD Government | 0.55% | 98.32 | -0.01% |
| AHEAD DB HOLDINGS, LLC AHEADDB 6.625 05/01/2028 FIX USD Corporate 144A | 0.53% | 99.95 | 0.11% |
Fees & Availability
| Fees | |
| Actual 12B-1 Fee | -- |
| Actual Management Fee | 0.65% |
| Administration Fee | -- |
| Maximum Front Load | -- |
| Maximum Deferred Load | -- |
| Maximum Redemption Fee | 0.00% |
| General Availability | |
| Available for Insurance Product | No |
| Available for RRSP | No |
| Purchase Details | |
| Open to New Investors |
|
| Minimum Initial Investment | 0.00 None |
| Minimum Subsequent Investment | 0.00 None |
Basic Info
| Investment Strategy | |
| The Fund seeks high level of current income. The Fund may also seek capital appreciation. The Fund will normally invest in income producing debt securities, preferred stocks and convertible securities with an emphasis on lower-quality debt securities. The Fund seeks to maintain an average duration of three years or less. |
| General | |
| Security Type | Mutual Fund |
| Equity Style | -- |
| Broad Asset Class | Taxable Bond |
| Broad Category | Fixed Income |
| Global Peer Group | Bond USD High Yield |
| Peer Group | Short High Yield Funds |
| Global Macro | Bond High Yield |
| US Macro | High Yield Funds |
| YCharts Categorization | -- |
| YCharts Benchmark | -- |
| Prospectus Objective | Short High Yield Funds |
| Fund Owner Firm Name | Fidelity Investments |
| Broad Asset Class Benchmark Index | |
| ^BBUSATR | 100.0% |
Fundamentals
| General | |
| Distribution Yield | -- |
| Dividend Yield TTM (6-8-26) | 7.33% |
| 30-Day SEC Yield (5-31-26) | 6.16% |
| 7-Day SEC Yield | -- |
| Number of Holdings | 578 |
| Bond | |
| Yield to Maturity (3-31-26) | 6.73% |
| Effective Duration | 1.66 |
| Average Coupon | 6.70% |
| Calculated Average Quality | 5.580 |
| Effective Maturity | 4.943 |
| Nominal Maturity | 5.453 |
| Number of Bond Holdings | 549 |
As of March 31, 2026
Fund Details
Top Portfolio Holders
| Name | % Weight |
|---|---|
| Portfolio A | 5.00% |
| Portfolio B | 3.50% |
| Portfolio C | 2.25% |
Excel Add-In Codes
| Name: =YCI("M:FSAHX", "name") |
| Broad Asset Class: =YCI("M:FSAHX", "broad_asset_class") |
| Broad Category: =YCI("M:FSAHX", "broad_category_group") |
| Prospectus Objective: =YCI("M:FSAHX", "prospectus_objective") |
| To find the codes for any of our securities and financial metrics, see our Complete Excel Reference. |