

PGIM Floating Rate Income Fund Z (FRFZX)
8.90
0.00 (0.00%)
USD |
Jun 10 2026
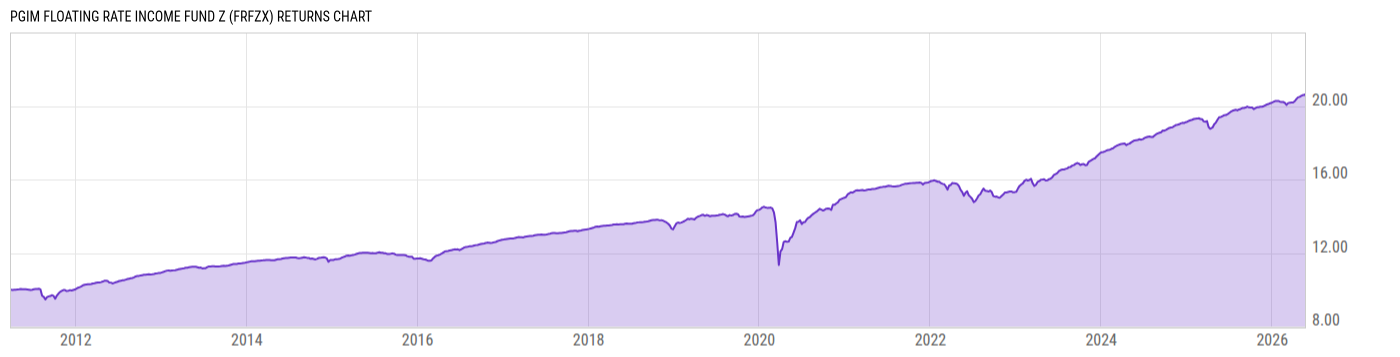
Returns Chart
Key Stats
| Net Expense Ratio | Total Assets Under Management | Weighted Average Dividend Yield | Turnover Ratio (Generic) |
|---|---|---|---|
| 0.71% | 1.999B | -- | 53.00% |
| 1 Year Fund Level Flows | 1 Year Total Returns (Daily) | Annualized Total Returns Since Inception (Daily) | Max Drawdown (Since Inception) |
| -484.45M | 5.87% |
Basic Info
| Investment Strategy | |
| The Fund seeks to maximize current income. As a secondary objective the Fund seeks capital appreciation when it is consistent with its primary objective. The Fund will invest at least 80% of its assets in senior floating rate loans and other floating rate debt securities. |
| General | |
| Security Type | Mutual Fund |
| Equity Style | -- |
| Broad Asset Class | Taxable Bond |
| Broad Category | Fixed Income |
| Global Peer Group | Loan Participation Funds |
| Peer Group | Loan Participation Funds |
| Global Macro | Loan Participation Funds |
| US Macro | General Domestic Taxable Fixed Income Funds |
| YCharts Categorization | -- |
| YCharts Benchmark | -- |
| Prospectus Objective | Loan Participation Funds |
| Fund Owner Firm Name | PGIM |
| Broad Asset Class Benchmark Index | |
| ^BBUSATR | 100.0% |
Net Fund Flows Versus Peer Group
1 Month
% Rank:
65
-120.38M
Peer Group Low
1.130B
Peer Group High
1 Year
% Rank:
84
-484.45M
-1.857B
Peer Group Low
6.524B
Peer Group High
3 Months
% Rank:
90
-902.22M
Peer Group Low
2.516B
Peer Group High
3 Years
% Rank:
69
-2.611B
Peer Group Low
21.94B
Peer Group High
6 Months
% Rank:
88
-1.596B
Peer Group Low
4.432B
Peer Group High
5 Years
% Rank:
24
-4.547B
Peer Group Low
24.56B
Peer Group High
YTD
% Rank:
89
-1.334B
Peer Group Low
3.795B
Peer Group High
10 Years
% Rank:
10
-10.87B
Peer Group Low
25.40B
Peer Group High
Date Unavailable
Risk
Performance Versus Peer Group
Annual Total Returns Versus Peers
As of June 11, 2026.
Asset Allocation
As of March 31, 2026.
| Type | % Net |
|---|---|
| Cash | -0.09% |
| Stock | 1.04% |
| Bond | 98.27% |
| Convertible | 0.00% |
| Preferred | 1.19% |
| Other | -0.41% |
Top 10 Holdings
| Name | % Weight | Price | % Change |
|---|---|---|---|
| The Bank of Nova Scotia BNS 7.35 04/27/2085 FLT USD Corporate '30 | 1.59% | 103.09 | 0.23% |
|
USD/EUR Forward Contract
|
1.51% | -- | -- |
|
Brookfield Property REIT Inc 28-MAY-2030 Term Loan B
|
1.32% | -- | -- |
| JPMorgan Chase & Co. JPM 6.43675 12/31/2099 FLT USD Corporate '25 | 1.17% | 100.04 | 0.04% |
| Wells Fargo & Company WFC 6.125 12/31/2099 FLT USD Corporate '31 | 1.07% | 100.56 | 0.28% |
|
RAD CLO LTD. 19R B1R FLT 6.27549% 22-MAR-2038
|
1.02% | -- | -- |
|
BATTALION CLO LTD 11RR BR2 FLT 5.61541% 24-APR-2034
|
1.02% | -- | -- |
| The Toronto-Dominion Bank TD 7.25 07/31/2084 FLT USD Corporate '29 | 0.98% | 103.57 | 0.35% |
|
Asurion LLC FRN
|
0.94% | -- | -- |
| The Toronto-Dominion Bank TD 6.35 10/31/2085 FLT USD Corporate '30 | 0.90% | 100.83 | 0.04% |
Fees & Availability
| Fees | |
| Actual 12B-1 Fee | -- |
| Actual Management Fee | 0.53% |
| Administration Fee | -- |
| Maximum Front Load | -- |
| Maximum Deferred Load | -- |
| Maximum Redemption Fee | -- |
| General Availability | |
| Available for Insurance Product | No |
| Available for RRSP | No |
| Purchase Details | |
| Open to New Investors |
|
| Minimum Initial Investment | 0.00 None |
| Minimum Subsequent Investment | 0.00 None |
Basic Info
| Investment Strategy | |
| The Fund seeks to maximize current income. As a secondary objective the Fund seeks capital appreciation when it is consistent with its primary objective. The Fund will invest at least 80% of its assets in senior floating rate loans and other floating rate debt securities. |
| General | |
| Security Type | Mutual Fund |
| Equity Style | -- |
| Broad Asset Class | Taxable Bond |
| Broad Category | Fixed Income |
| Global Peer Group | Loan Participation Funds |
| Peer Group | Loan Participation Funds |
| Global Macro | Loan Participation Funds |
| US Macro | General Domestic Taxable Fixed Income Funds |
| YCharts Categorization | -- |
| YCharts Benchmark | -- |
| Prospectus Objective | Loan Participation Funds |
| Fund Owner Firm Name | PGIM |
| Broad Asset Class Benchmark Index | |
| ^BBUSATR | 100.0% |
Fundamentals
| General | |
| Distribution Yield | -- |
| Dividend Yield TTM (6-10-26) | 7.39% |
| 30-Day SEC Yield (4-30-26) | 6.38% |
| 7-Day SEC Yield | -- |
| Number of Holdings | 428 |
| Bond | |
| Yield to Maturity (3-31-26) | 6.00% |
| Effective Duration | 3.99 |
| Average Coupon | 6.27% |
| Calculated Average Quality | 4.096 |
| Effective Maturity | 8.742 |
| Nominal Maturity | 10.00 |
| Number of Bond Holdings | 363 |
As of March 31, 2026
Fund Details
Top Portfolio Holders
| Name | % Weight |
|---|---|
| Portfolio A | 5.00% |
| Portfolio B | 3.50% |
| Portfolio C | 2.25% |
Excel Add-In Codes
| Name: =YCI("M:FRFZX", "name") |
| Broad Asset Class: =YCI("M:FRFZX", "broad_asset_class") |
| Broad Category: =YCI("M:FRFZX", "broad_category_group") |
| Prospectus Objective: =YCI("M:FRFZX", "prospectus_objective") |
| To find the codes for any of our securities and financial metrics, see our Complete Excel Reference. |