

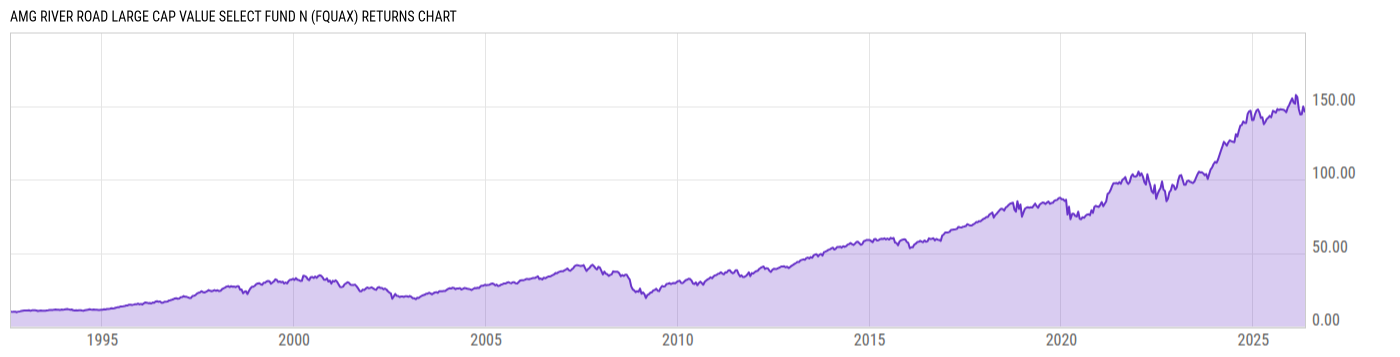
AMG River Road Large Cap Value Select Fund N (FQUAX)
18.94
-0.07
(-0.37%)
USD |
May 08 2026
Returns Chart
Key Stats
| Net Expense Ratio | Total Assets Under Management | Weighted Average Dividend Yield | Turnover Ratio (Generic) |
|---|---|---|---|
| 0.95% | 42.69M | 1.38% | 115.0% |
| 1 Year Fund Level Flows | 1 Year Total Returns (Daily) | Annualized Total Returns Since Inception (Daily) | Max Drawdown (Since Inception) |
| -10.72M | 3.78% |
Basic Info
| Investment Strategy | |
| The Fund seeks long-term capital appreciation by investing in the stocks of large U.S. companies. Normally, the Fund will invest at least 65% of its total assets in these large cap stocks. |
| General | |
| Security Type | Mutual Fund |
| Equity Style | Multi Cap Value |
| Broad Asset Class | US Equity |
| Broad Category | Equity |
| Global Peer Group | Equity US |
| Peer Group | Large-Cap Value Funds |
| Global Macro | Equity North America |
| US Macro | Large-Cap Funds |
| YCharts Categorization | -- |
| YCharts Benchmark | -- |
| Prospectus Objective | Growth & Income Funds |
| Fund Owner Firm Name | AMG |
| Broad Asset Class Benchmark Index | |
| ^SPXTR | 100.0% |
Net Fund Flows Versus Peer Group
1 Month
% Rank:
41
-2.064B
Peer Group Low
332.57M
Peer Group High
1 Year
% Rank:
34
-10.72M
-11.54B
Peer Group Low
3.743B
Peer Group High
3 Months
% Rank:
35
-4.066B
Peer Group Low
1.385B
Peer Group High
3 Years
% Rank:
23
-31.67B
Peer Group Low
14.13B
Peer Group High
6 Months
% Rank:
31
-7.282B
Peer Group Low
3.021B
Peer Group High
5 Years
% Rank:
32
-41.52B
Peer Group Low
15.12B
Peer Group High
YTD
% Rank:
30
-5.212B
Peer Group Low
1.984B
Peer Group High
10 Years
% Rank:
30
-42.64B
Peer Group Low
14.13B
Peer Group High
Date Unavailable
Risk
Performance Versus Peer Group
Annual Total Returns Versus Peers
As of May 08, 2026.
Asset Allocation
As of March 31, 2026.
| Type | % Net |
|---|---|
| Cash | 1.02% |
| Stock | 98.96% |
| Bond | 0.00% |
| Convertible | 0.00% |
| Preferred | 0.00% |
| Other | 0.02% |
Top 10 Holdings
| Name | % Weight | Price | % Change |
|---|---|---|---|
| Berkshire Hathaway, Inc. | 8.17% | 475.52 | 0.09% |
| BJ's Wholesale Club Holdings, Inc. | 6.69% | 92.99 | -1.42% |
| Union Pacific Corp. | 4.96% | 264.53 | -0.14% |
| CRH Plc | 4.89% | 113.73 | 0.98% |
| Fairfax Financial Holdings Ltd. | 4.78% | 2247.48 | 1.62% |
| Labcorp Holdings, Inc. | 4.65% | 254.07 | -1.54% |
| Willis Towers Watson Plc | 4.57% | 256.44 | -0.63% |
| American Express Co. | 4.41% | 316.01 | -0.84% |
| The Walt Disney Co. | 4.30% | 108.00 | -0.61% |
| Amrize Ltd. | 3.70% | 52.88 | -1.10% |
Fees & Availability
| Fees | |
| Actual 12B-1 Fee | 0.25% |
| Actual Management Fee | 0.20% |
| Administration Fee | 9.72K% |
| Maximum Front Load | 0.00% |
| Maximum Deferred Load | -- |
| Maximum Redemption Fee | -- |
| General Availability | |
| Available for Insurance Product | No |
| Available for RRSP | No |
| Purchase Details | |
| Open to New Investors |
|
| Minimum Initial Investment | 2000.00 None |
| Minimum Subsequent Investment | 100.00 None |
Basic Info
| Investment Strategy | |
| The Fund seeks long-term capital appreciation by investing in the stocks of large U.S. companies. Normally, the Fund will invest at least 65% of its total assets in these large cap stocks. |
| General | |
| Security Type | Mutual Fund |
| Equity Style | Multi Cap Value |
| Broad Asset Class | US Equity |
| Broad Category | Equity |
| Global Peer Group | Equity US |
| Peer Group | Large-Cap Value Funds |
| Global Macro | Equity North America |
| US Macro | Large-Cap Funds |
| YCharts Categorization | -- |
| YCharts Benchmark | -- |
| Prospectus Objective | Growth & Income Funds |
| Fund Owner Firm Name | AMG |
| Broad Asset Class Benchmark Index | |
| ^SPXTR | 100.0% |
Fundamentals
| General | |
| Distribution Yield | -- |
| Dividend Yield TTM (5-7-26) | 0.68% |
| 30-Day SEC Yield (3-31-26) | 0.38% |
| 7-Day SEC Yield | -- |
| Number of Holdings | 31 |
| Stock | |
| Weighted Average PE Ratio | 20.28 |
| Weighted Average Price to Sales Ratio | 2.473 |
| Weighted Average Price to Book Ratio | 3.840 |
| Weighted Median ROE | 20.25% |
| Weighted Median ROA | 5.95% |
| ROI (TTM) | 11.85% |
| Return on Investment (TTM) | 11.85% |
| Earning Yield | 0.0595 |
| LT Debt / Shareholders Equity | 0.8055 |
| Number of Equity Holdings | 29 |
As of March 31, 2026
Growth Metrics
| EPS Growth (1Y) | 11.31% |
| EPS Growth (3Y) | 12.13% |
| EPS Growth (5Y) | 18.89% |
| Sales Growth (1Y) | 3.44% |
| Sales Growth (3Y) | 6.07% |
| Sales Growth (5Y) | 9.60% |
| Sales per Share Growth (1Y) | 5.58% |
| Sales per Share Growth (3Y) | 8.15% |
| Operating Cash Flow - Growth Rate (3Y) | 13.29% |
As of March 31, 2026
Fund Details
| Key Dates | |
| Inception Date | 8/14/1992 |
| Last Annual Report Date | 10/31/2025 |
| Last Prospectus Date | 3/1/2026 |
| Share Classes | |
| MEQFX | Inst |
| Attributes | |
| Index Fund | -- |
| Inverse Fund | No |
| Leveraged Fund | -- |
| Fund of Funds | No |
| Currency Hedged Fund | -- |
| Socially Responsible Fund | No |
Top Portfolio Holders
| Name | % Weight |
|---|---|
| Portfolio A | 5.00% |
| Portfolio B | 3.50% |
| Portfolio C | 2.25% |
Excel Add-In Codes
| Name: =YCI("M:FQUAX", "name") |
| Broad Asset Class: =YCI("M:FQUAX", "broad_asset_class") |
| Broad Category: =YCI("M:FQUAX", "broad_category_group") |
| Prospectus Objective: =YCI("M:FQUAX", "prospectus_objective") |
| To find the codes for any of our securities and financial metrics, see our Complete Excel Reference. |