

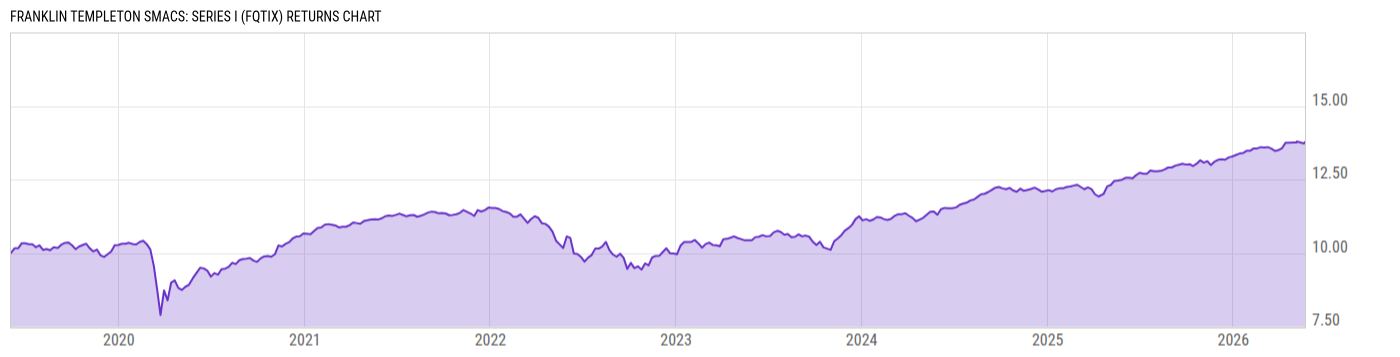
Franklin Templeton SMACS: Series I (FQTIX)
8.18
+0.02
(+0.25%)
USD |
May 22 2026
Returns Chart
Key Stats
| Net Expense Ratio | Total Assets Under Management | Weighted Average Dividend Yield | Turnover Ratio (Generic) |
|---|---|---|---|
| 0.00% | 835.72M | -- | 52.00% |
| 1 Year Fund Level Flows | 1 Year Total Returns (Daily) | Annualized Total Returns Since Inception (Daily) | Max Drawdown (Since Inception) |
| 300.55M | 10.74% |
Basic Info
| Investment Strategy | |
| The Fund seeks to maximize income while maintaining prospects for capital appreciation. The Fund, under normal market conditions, invests predominantly in debt securities which include all varieties of fixed, floating and variable tate instruments, including secured and unsecured bonds, and short-term instruments. |
| General | |
| Security Type | Mutual Fund |
| Equity Style | -- |
| Broad Asset Class | Taxable Bond |
| Broad Category | Alternative Strategies |
| Global Peer Group | Alternative Credit Focus |
| Peer Group | Alternative Credit Focus Funds |
| Global Macro | Alternative Bond |
| US Macro | Alternative Bond Funds |
| YCharts Categorization | -- |
| YCharts Benchmark | -- |
| Prospectus Objective | Alternative Credit Focus Funds |
| Fund Owner Firm Name | Franklin Templeton |
| Broad Asset Class Benchmark Index | |
| ^BBUSATR | 100.0% |
Net Fund Flows Versus Peer Group
1 Month
% Rank:
15
-137.10M
Peer Group Low
639.74M
Peer Group High
1 Year
% Rank:
20
300.55M
-883.73M
Peer Group Low
3.386B
Peer Group High
3 Months
% Rank:
26
-251.93M
Peer Group Low
1.370B
Peer Group High
3 Years
% Rank:
25
-718.77M
Peer Group Low
2.547B
Peer Group High
6 Months
% Rank:
20
-479.25M
Peer Group Low
2.318B
Peer Group High
5 Years
% Rank:
16
-1.869B
Peer Group Low
2.593B
Peer Group High
YTD
% Rank:
26
-323.16M
Peer Group Low
1.964B
Peer Group High
10 Years
% Rank:
20
-12.03B
Peer Group Low
6.106B
Peer Group High
Date Unavailable
Risk
Performance Versus Peer Group
Annual Total Returns Versus Peers
As of May 26, 2026.
Asset Allocation
As of March 31, 2026.
| Type | % Net |
|---|---|
| Cash | -2.19% |
| Stock | 0.29% |
| Bond | 98.90% |
| Convertible | 0.00% |
| Preferred | 0.00% |
| Other | 3.00% |
Top 10 Holdings
| Name | % Weight | Price | % Change |
|---|---|---|---|
| CHS/Community Health Systems, Inc. COMMHS 6.125 04/01/2030 FIX USD Corporate 144A | 3.81% | 89.55 | 0.01% |
|
GOVERNMENT NATIONAL MORTGAGE ASSOCIATION 2 20-OCT-2055 MB0686
|
2.73% | -- | -- |
| CHS/Community Health Systems, Inc. COMMHS 10.75 06/15/2033 FIX USD Corporate 144A | 2.33% | 107.12 | 0.00% |
| CCO Holdings, LLC CHTR-CCOH 7.0 02/01/2033 FIX USD Corporate 144A | 2.26% | 97.31 | 0.00% |
| Venture Global LNG, Inc. VENTUGL 9.875 02/01/2032 FIX USD Corporate 144A | 2.15% | 107.13 | 0.03% |
| Venture Global LNG, Inc. VENTUGL 9.0 12/31/2099 FLT USD Corporate 144A '29 | 1.99% | 99.79 | -0.02% |
| TENET HEALTHCARE CORPORATION THC 6.75 05/15/2031 FIX USD Corporate 144A | 1.92% | 102.78 | 0.00% |
| CHS/Community Health Systems, Inc. COMMHS 6.875 04/15/2029 FIX USD Corporate 144A | 1.80% | 98.51 | 0.00% |
| BEACH ACQUISITION BIDCO, LLC BEACHAC 07/15/2033 VAR USD Corporate 144A | 1.75% | 110.06 | -0.01% |
| CHS/Community Health Systems, Inc. COMMHS 10.875 01/15/2032 FIX USD Corporate 144A | 1.72% | 107.84 | 0.01% |
Fees & Availability
| Fees | |
| Actual 12B-1 Fee | -- |
| Actual Management Fee | -- |
| Administration Fee | -- |
| Maximum Front Load | -- |
| Maximum Deferred Load | -- |
| Maximum Redemption Fee | 1.00% |
| General Availability | |
| Available for Insurance Product | No |
| Available for RRSP | No |
| Purchase Details | |
| Open to New Investors |
|
| Minimum Initial Investment | 0.00 None |
| Minimum Subsequent Investment | 0.00 None |
Basic Info
| Investment Strategy | |
| The Fund seeks to maximize income while maintaining prospects for capital appreciation. The Fund, under normal market conditions, invests predominantly in debt securities which include all varieties of fixed, floating and variable tate instruments, including secured and unsecured bonds, and short-term instruments. |
| General | |
| Security Type | Mutual Fund |
| Equity Style | -- |
| Broad Asset Class | Taxable Bond |
| Broad Category | Alternative Strategies |
| Global Peer Group | Alternative Credit Focus |
| Peer Group | Alternative Credit Focus Funds |
| Global Macro | Alternative Bond |
| US Macro | Alternative Bond Funds |
| YCharts Categorization | -- |
| YCharts Benchmark | -- |
| Prospectus Objective | Alternative Credit Focus Funds |
| Fund Owner Firm Name | Franklin Templeton |
| Broad Asset Class Benchmark Index | |
| ^BBUSATR | 100.0% |
Fundamentals
| General | |
| Distribution Yield | -- |
| Dividend Yield TTM (5-21-26) | 7.52% |
| 30-Day SEC Yield (4-30-26) | 6.90% |
| 7-Day SEC Yield | -- |
| Number of Holdings | 10 |
| Bond | |
| Yield to Maturity (3-31-26) | 7.32% |
| Effective Duration | 3.15 |
| Average Coupon | 7.79% |
| Calculated Average Quality | 5.889 |
| Effective Maturity | 10.41 |
| Nominal Maturity | 10.51 |
| Number of Bond Holdings | 8 |
As of March 31, 2026
Fund Details
| Key Dates | |
| Inception Date | 6/3/2019 |
| Last Annual Report Date | 8/31/2025 |
| Last Prospectus Date | 1/1/2026 |
| Attributes | |
| Index Fund | -- |
| Inverse Fund | No |
| Leveraged Fund | -- |
| Fund of Funds | No |
| Currency Hedged Fund | -- |
| Socially Responsible Fund | No |
Top Portfolio Holders
| Name | % Weight |
|---|---|
| Portfolio A | 5.00% |
| Portfolio B | 3.50% |
| Portfolio C | 2.25% |
Excel Add-In Codes
| Name: =YCI("M:FQTIX", "name") |
| Broad Asset Class: =YCI("M:FQTIX", "broad_asset_class") |
| Broad Category: =YCI("M:FQTIX", "broad_category_group") |
| Prospectus Objective: =YCI("M:FQTIX", "prospectus_objective") |
| To find the codes for any of our securities and financial metrics, see our Complete Excel Reference. |