

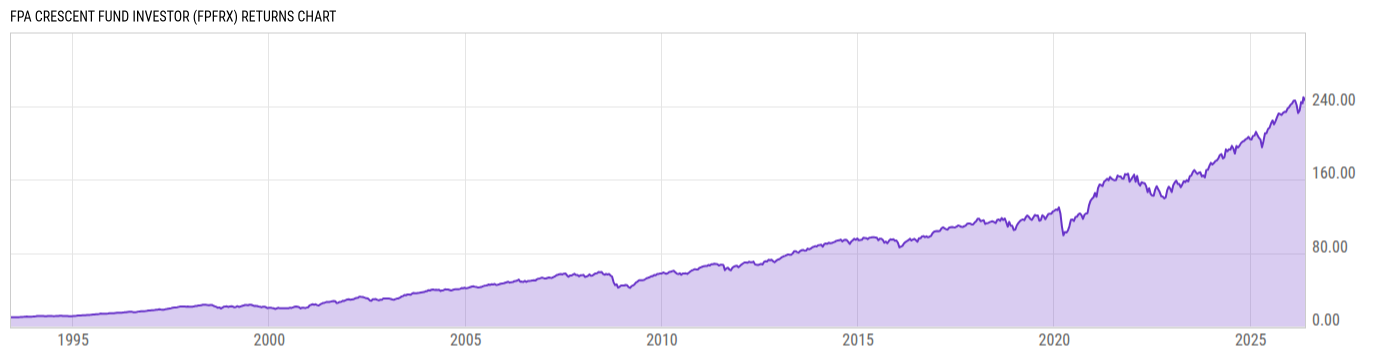
FPA Crescent Fund Investor (FPFRX)
44.39
-0.23
(-0.52%)
USD |
May 19 2026
Returns Chart
Key Stats
| Net Expense Ratio | Total Assets Under Management | Weighted Average Dividend Yield | Turnover Ratio (Generic) |
|---|---|---|---|
| 1.15% | 12.26B | 1.68% | 23.00% |
| 1 Year Fund Level Flows | 1 Year Total Returns (Daily) | Annualized Total Returns Since Inception (Daily) | Max Drawdown (Since Inception) |
| -269.36M | 15.99% |
Basic Info
| Investment Strategy | |
| The Fund seeks to generate equity-like returns over the long-term, take less risk than the market and avoid permanent impairment of capital. The Fund actively invests in both the equity and debt securities of companies because the Adviser believes that this combination of securities broadens the universe of opportunities. |
| General | |
| Security Type | Mutual Fund |
| Equity Style | Multi Cap Value |
| Broad Asset Class | Allocation |
| Broad Category | Allocation |
| Global Peer Group | Mixed Asset USD Flexible - US |
| Peer Group | Flexible Portfolio Funds |
| Global Macro | Mixed Asset HC Flexible |
| US Macro | Mixed-Assets Funds |
| YCharts Categorization | -- |
| YCharts Benchmark | -- |
| Prospectus Objective | Flexible Portfolio Funds |
| Fund Owner Firm Name | FPA |
| Broad Asset Class Benchmark Index | |
| ^SPXTR | 100.0% |
Net Fund Flows Versus Peer Group
1 Month
% Rank:
96
-159.25M
Peer Group Low
4.075B
Peer Group High
1 Year
% Rank:
88
-269.36M
-3.214B
Peer Group Low
4.075B
Peer Group High
3 Months
% Rank:
56
-582.29M
Peer Group Low
4.075B
Peer Group High
3 Years
% Rank:
87
-12.12B
Peer Group Low
4.168B
Peer Group High
6 Months
% Rank:
94
-1.396B
Peer Group Low
4.075B
Peer Group High
5 Years
% Rank:
94
-14.74B
Peer Group Low
4.971B
Peer Group High
YTD
% Rank:
20
-927.39M
Peer Group Low
4.075B
Peer Group High
10 Years
% Rank:
97
-47.38B
Peer Group Low
9.619B
Peer Group High
Date Unavailable
Risk
Performance Versus Peer Group
Annual Total Returns Versus Peers
As of May 21, 2026.
Asset Allocation
As of March 31, 2026.
| Type | % Net |
|---|---|
| Cash | 23.71% |
| Stock | 60.07% |
| Bond | 16.22% |
| Convertible | 0.00% |
| Preferred | 0.00% |
| Other | -0.00% |
Top 10 Holdings
| Name | % Weight | Price | % Change |
|---|---|---|---|
| Analog Devices, Inc. | 3.17% | 397.43 | -4.07% |
| Alphabet, Inc. | 2.89% | 388.95 | 0.33% |
| Meta Platforms, Inc. | 2.14% | 604.93 | 0.38% |
|
Equity General Security
|
2.10% | -- | -- |
| International Flavors & Fragrances, Inc. | 1.94% | 74.42 | 3.38% |
| TE Connectivity Plc | 1.91% | 201.48 | 2.76% |
| Citigroup, Inc. | 1.88% | 124.79 | 4.02% |
| Heineken Holding NV | 1.86% | 70.91 | 3.62% |
|
JDE Peets NV ORD
|
1.84% | -- | -- |
| Alphabet, Inc. | 1.81% | 385.00 | 0.03% |
Fees & Availability
| Fees | |
| Actual 12B-1 Fee | -- |
| Actual Management Fee | 0.89% |
| Administration Fee | 12.55K% |
| Maximum Front Load | -- |
| Maximum Deferred Load | -- |
| Maximum Redemption Fee | -- |
| General Availability | |
| Available for Insurance Product | No |
| Available for RRSP | No |
| Purchase Details | |
| Open to New Investors |
|
| Minimum Initial Investment | 1500.00 None |
| Minimum Subsequent Investment | 100.00 None |
Basic Info
| Investment Strategy | |
| The Fund seeks to generate equity-like returns over the long-term, take less risk than the market and avoid permanent impairment of capital. The Fund actively invests in both the equity and debt securities of companies because the Adviser believes that this combination of securities broadens the universe of opportunities. |
| General | |
| Security Type | Mutual Fund |
| Equity Style | Multi Cap Value |
| Broad Asset Class | Allocation |
| Broad Category | Allocation |
| Global Peer Group | Mixed Asset USD Flexible - US |
| Peer Group | Flexible Portfolio Funds |
| Global Macro | Mixed Asset HC Flexible |
| US Macro | Mixed-Assets Funds |
| YCharts Categorization | -- |
| YCharts Benchmark | -- |
| Prospectus Objective | Flexible Portfolio Funds |
| Fund Owner Firm Name | FPA |
| Broad Asset Class Benchmark Index | |
| ^SPXTR | 100.0% |
Fundamentals
| General | |
| Distribution Yield | -- |
| Dividend Yield TTM (5-18-26) | 2.49% |
| 30-Day SEC Yield | -- |
| 7-Day SEC Yield | -- |
| Number of Holdings | 146 |
| Stock | |
| Weighted Average PE Ratio | 25.39 |
| Weighted Average Price to Sales Ratio | 4.023 |
| Weighted Average Price to Book Ratio | 3.908 |
| Weighted Median ROE | 15.77% |
| Weighted Median ROA | 7.23% |
| ROI (TTM) | 10.36% |
| Return on Investment (TTM) | 10.36% |
| Earning Yield | 0.0545 |
| LT Debt / Shareholders Equity | 0.7084 |
| Number of Equity Holdings | 78 |
| Bond | |
| Yield to Maturity (3-31-26) | 2.90% |
| Effective Duration | -- |
| Average Coupon | 3.72% |
| Calculated Average Quality | 6.464 |
| Effective Maturity | 0.6870 |
| Nominal Maturity | 0.8175 |
| Number of Bond Holdings | 29 |
As of March 31, 2026
Growth Metrics
| EPS Growth (1Y) | 18.42% |
| EPS Growth (3Y) | 4.86% |
| EPS Growth (5Y) | 18.09% |
| Sales Growth (1Y) | 6.69% |
| Sales Growth (3Y) | 4.57% |
| Sales Growth (5Y) | 10.39% |
| Sales per Share Growth (1Y) | 7.94% |
| Sales per Share Growth (3Y) | 5.98% |
| Operating Cash Flow - Growth Rate (3Y) | 8.69% |
As of March 31, 2026
Top Portfolio Holders
| Name | % Weight |
|---|---|
| Portfolio A | 5.00% |
| Portfolio B | 3.50% |
| Portfolio C | 2.25% |
Excel Add-In Codes
| Name: =YCI("M:FPFRX", "name") |
| Broad Asset Class: =YCI("M:FPFRX", "broad_asset_class") |
| Broad Category: =YCI("M:FPFRX", "broad_category_group") |
| Prospectus Objective: =YCI("M:FPFRX", "prospectus_objective") |
| To find the codes for any of our securities and financial metrics, see our Complete Excel Reference. |