

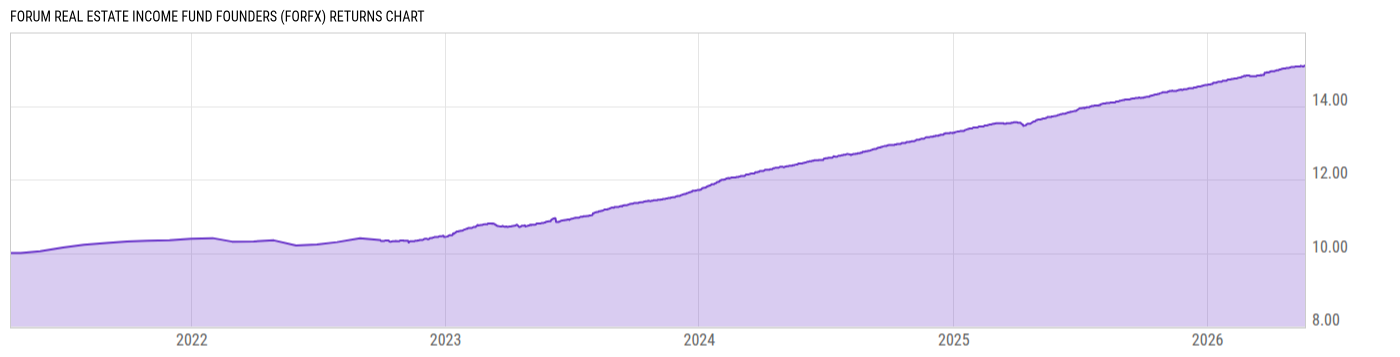
Forum Real Estate Income Fund Founders (FORFX)
9.74
0.00 (0.00%)
USD |
May 21 2026
Returns Chart
Key Stats
| Net Expense Ratio | Total Assets Under Management | Weighted Average Dividend Yield | Turnover Ratio (Generic) |
|---|---|---|---|
| 2.99% | 442.60M | -- | 81.00% |
| 1 Year Fund Level Flows | 1 Year Total Returns (Daily) | Annualized Total Returns Since Inception (Daily) | Max Drawdown (Since Inception) |
| -- | 10.14% |
Basic Info
| Investment Strategy | |
| The Fund seeks to maximize current income and preserve investor capital, with a secondary focus on long-term capital appreciation. The Fund normally invests at least 80% of its net assets in a portfolio of commercial real estate loans and other real estate-related investments located in the United States. |
| General | |
| Security Type | Unlisted Closed-End Fund |
| Equity Style | -- |
| Broad Asset Class | Taxable Bond |
| Broad Category | Fixed Income |
| Global Peer Group | Bond USD Mortgages |
| Peer Group | U.S. Mortgage Funds |
| Global Macro | Bond HC |
| US Macro | U.S. Government & Treasury Fixed Income Funds |
| YCharts Categorization | -- |
| YCharts Benchmark | -- |
| Prospectus Objective | U.S. Mortgage Funds |
| Fund Owner Firm Name | Forum Capital Advisors |
| Broad Asset Class Benchmark Index | |
| ^BBUSATR | 100.0% |
Net Fund Flows Versus Peer Group
1 Month
% Rank:
--
-478.98M
Peer Group Low
425.34M
Peer Group High
1 Year
% Rank:
--
-1.067B
Peer Group Low
1.278B
Peer Group High
3 Months
% Rank:
--
-1.037B
Peer Group Low
372.55M
Peer Group High
3 Years
% Rank:
--
-6.471B
Peer Group Low
7.384B
Peer Group High
6 Months
% Rank:
--
-3.987B
Peer Group Low
734.51M
Peer Group High
5 Years
% Rank:
--
-18.54B
Peer Group Low
10.19B
Peer Group High
YTD
% Rank:
--
-930.89M
Peer Group Low
632.98M
Peer Group High
10 Years
% Rank:
--
-35.01B
Peer Group Low
25.87B
Peer Group High
Date Unavailable
Risk
Performance Versus Peer Group
Annual Total Returns Versus Peers
As of May 22, 2026.
Asset Allocation
As of December 31, 2025.
| Type | % Net |
|---|---|
| Cash | -18.10% |
| Stock | 0.33% |
| Bond | 106.9% |
| Convertible | 0.00% |
| Preferred | 9.98% |
| Other | 0.86% |
Top 10 Holdings
| Name | % Weight | Price | % Change |
|---|---|---|---|
|
The Royal Senior Mtg FRN 06-Feb-2026
|
6.86% | -- | -- |
|
FREMF MORTGAGE TRUST 21KF98 CS FLT 12.70185% 25-DEC-2030
|
6.64% | -- | -- |
|
USD Cash
|
5.01% | -- | -- |
|
Park West PFD
|
4.59% | -- | -- |
|
FREMF MORTGAGE TRUST 20KF88 C FLT 6.72145% 25-SEP-2030
|
4.15% | -- | -- |
|
BX TRUST 25VLT7 A SEQ FLT 5.65896% 15-JUL-2044
|
3.80% | -- | -- |
|
BX COMMERCIAL MORTGAGE TRUST 25VOLT A FLT 15-DEC-2044
|
3.54% | -- | -- |
|
Gm Palace Bts PFD
|
3.18% | -- | -- |
|
FREMF MORTGAGE TRUST 20KF83 C SEQ FLT 6.18449% 25-JUL-2030
|
3.13% | -- | -- |
|
GREAT WOLF TRUST 24WOLF G FLT 9.39496% 15-MAR-2039
|
3.05% | -- | -- |
Fees & Availability
| Fees | |
| Actual 12B-1 Fee | -- |
| Actual Management Fee | 0.67% |
| Administration Fee | 131.9K% |
| Maximum Front Load | -- |
| Maximum Deferred Load | -- |
| Maximum Redemption Fee | -- |
| General Availability | |
| Available for Insurance Product | No |
| Available for RRSP | No |
| Purchase Details | |
| Open to New Investors |
|
| Minimum Initial Investment | 25.00M None |
| Minimum Subsequent Investment | 5000.00 None |
Basic Info
| Investment Strategy | |
| The Fund seeks to maximize current income and preserve investor capital, with a secondary focus on long-term capital appreciation. The Fund normally invests at least 80% of its net assets in a portfolio of commercial real estate loans and other real estate-related investments located in the United States. |
| General | |
| Security Type | Unlisted Closed-End Fund |
| Equity Style | -- |
| Broad Asset Class | Taxable Bond |
| Broad Category | Fixed Income |
| Global Peer Group | Bond USD Mortgages |
| Peer Group | U.S. Mortgage Funds |
| Global Macro | Bond HC |
| US Macro | U.S. Government & Treasury Fixed Income Funds |
| YCharts Categorization | -- |
| YCharts Benchmark | -- |
| Prospectus Objective | U.S. Mortgage Funds |
| Fund Owner Firm Name | Forum Capital Advisors |
| Broad Asset Class Benchmark Index | |
| ^BBUSATR | 100.0% |
Fundamentals
| General | |
| Distribution Yield | -- |
| Dividend Yield TTM (5-20-26) | 8.54% |
| 30-Day SEC Yield | -- |
| 7-Day SEC Yield | -- |
| Number of Holdings | 76 |
| Bond | |
| Yield to Maturity (12-31-25) | 5.86% |
| Effective Duration | -- |
| Average Coupon | 7.41% |
| Calculated Average Quality | 2.893 |
| Effective Maturity | 9.677 |
| Nominal Maturity | 9.677 |
| Number of Bond Holdings | 61 |
As of December 31, 2025
Fund Details
Top Portfolio Holders
| Name | % Weight |
|---|---|
| Portfolio A | 5.00% |
| Portfolio B | 3.50% |
| Portfolio C | 2.25% |