

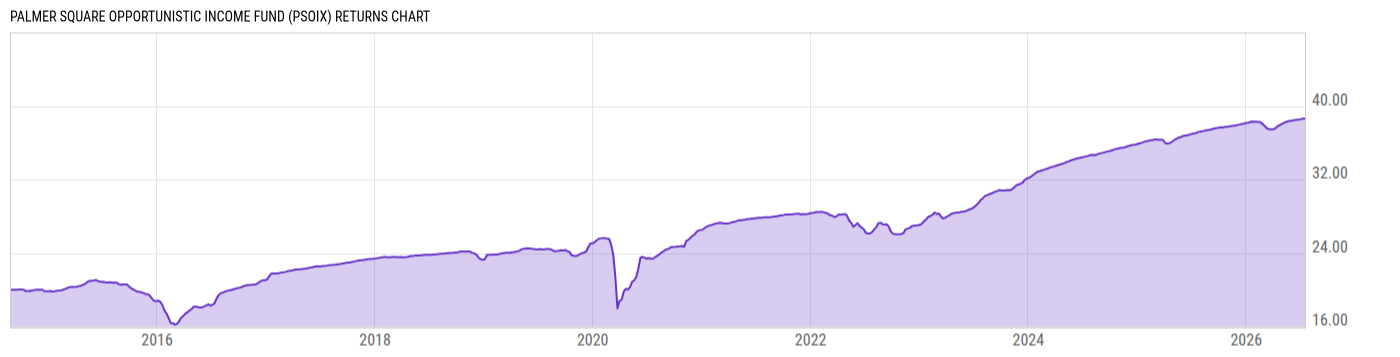
Palmer Square Opportunistic Income Fund (PSOIX)
17.35
+0.01
(+0.06%)
USD |
Jul 17 2026
Returns Chart
Key Stats
| Net Expense Ratio | Total Assets Under Management | Weighted Average Dividend Yield | Turnover Ratio (Generic) |
|---|---|---|---|
| 1.99% | 448.53M | -- | 75.00% |
| 1 Year Fund Level Flows | 1 Year Total Returns (Daily) | Annualized Total Returns Since Inception (Daily) | Max Drawdown (Since Inception) |
| -- | 4.17% |
Basic Info
| Investment Strategy | |
| The Fund seeks a high level of current income and secondarily, long-term capital appreciation. The Fund normally invests at least 80% of its net assets in debt securities and/or income producing securities. It may invest in debt securities of any maturity and credit quality, including securities below investment grade. |
| General | |
| Security Type | Unlisted Closed-End Fund |
| Equity Style | -- |
| Broad Asset Class | Taxable Bond |
| Broad Category | Fixed Income |
| Global Peer Group | Bond USD |
| Peer Group | General Bond Funds |
| Global Macro | Bond HC |
| US Macro | General Domestic Taxable Fixed Income Funds |
| YCharts Categorization | -- |
| YCharts Benchmark | -- |
| Prospectus Objective | General Bond Funds |
| Fund Owner Firm Name | Guardian |
| Broad Asset Class Benchmark Index | |
| ^BBUSATR | 100.0% |
Net Fund Flows Versus Peer Group
1 Month
% Rank:
--
-1.507B
Peer Group Low
2.887B
Peer Group High
1 Year
% Rank:
--
-4.188B
Peer Group Low
8.339B
Peer Group High
3 Months
% Rank:
--
-2.386B
Peer Group Low
6.274B
Peer Group High
3 Years
% Rank:
--
-14.23B
Peer Group Low
15.99B
Peer Group High
6 Months
% Rank:
--
-2.394B
Peer Group Low
7.987B
Peer Group High
5 Years
% Rank:
--
-3.047B
Peer Group Low
48.67B
Peer Group High
YTD
% Rank:
--
-2.394B
Peer Group Low
7.987B
Peer Group High
10 Years
% Rank:
--
-1.866B
Peer Group Low
82.82B
Peer Group High
Date Unavailable
Risk
Performance Versus Peer Group
Annual Total Returns Versus Peers
As of July 21, 2026.
Asset Allocation
As of October 31, 2025.
| Type | % Net |
|---|---|
| Cash | -0.18% |
| Stock | 0.00% |
| Bond | 80.99% |
| Convertible | 0.00% |
| Preferred | 0.00% |
| Other | 19.19% |
Top 10 Holdings
| Name | % Weight | Price | % Change |
|---|---|---|---|
|
PSOIX FUNDING I LLC
|
7.03% | -- | -- |
| Fidelity Instl Treasury Portfolio I | 4.55% | 1.00 | 0.00% |
|
RR LTD 23 SUB VAR 15-OCT-2123
|
2.27% | -- | -- |
|
SIXTH STREET CLO LTD 26 SUB VAR 0% 19-OCT-2037
|
1.64% | -- | -- |
|
REGATTA FUNDING LTD 17 SUB VAR 0% 15-OCT-2037
|
1.63% | -- | -- |
|
REGATTA FUNDING LTD 12 SUB VAR 0% 15-OCT-2037
|
1.27% | -- | -- |
|
COLUMBIA CENT CLO LIMITED 35 A1 SEQ FLT 5.06802% 25-JUL-2036
|
1.16% | -- | -- |
|
BROAD RIVER BSL FUNDING CLO 201R AR FLT 5.09924% 20-JUL-2034
|
0.93% | -- | -- |
|
VOYA CLO 211 IN VAR 0% 17-JUL-2034
|
0.84% | -- | -- |
|
GS MORTGAGE SECURITIES CORPORATION TRUST 12BWTR A SEQ FIX 2.954% 07-NOV-2034
|
0.81% | -- | -- |
Fees & Availability
| Fees | |
| Actual 12B-1 Fee | 0.12% |
| Actual Management Fee | 1.00% |
| Administration Fee | 388.2K% |
| Maximum Front Load | 3.00% |
| Maximum Deferred Load | -- |
| Maximum Redemption Fee | -- |
| General Availability | |
| Available for Insurance Product | No |
| Available for RRSP | No |
| Purchase Details | |
| Open to New Investors |
|
| Minimum Initial Investment | 250000.0 None |
| Minimum Subsequent Investment | 2500.00 None |
Projected Income
| Type | Jul | Aug | Sep | Oct | Nov | Dec | Jan | Feb | Mar | Apr | May | Jun |
|---|---|---|---|---|---|---|---|---|---|---|---|---|
|
Qualified Income
|
-- | -- | -- | -- | -- | -- | -- | -- | -- | -- | -- | -- |
|
Normal
|
-- | -- | -- | -- | -- | -- | -- | -- | -- | -- | -- | -- |
|
Qualified
|
-- | -- | -- | -- | -- | -- | -- | -- | -- | -- | -- | -- |
|
LT Cap Gains
|
-- | -- | -- | -- | -- | -- | -- | -- | -- | -- | -- | -- |
|
Ordinary Income
|
-- | -- | -- | -- | -- | -- | -- | -- | -- | -- | -- | -- |
|
Non-Qual
|
-- | -- | -- | -- | -- | -- | -- | -- | -- | -- | -- | -- |
|
ST Cap Gains
|
-- | -- | -- | -- | -- | -- | -- | -- | -- | -- | -- | -- |
|
Interest
|
-- | -- | -- | -- | -- | -- | -- | -- | -- | -- | -- | -- |
|
Tax-Exempt
|
-- | -- | -- | -- | -- | -- | -- | -- | -- | -- | -- | -- |
|
ROC
|
-- | -- | -- | -- | -- | -- | -- | -- | -- | -- | -- | -- |
|
Other
|
-- | -- | -- | -- | -- | -- | -- | -- | -- | -- | -- | -- |
|
Total
|
-- | -- | -- | -- | -- | -- | -- | -- | -- | -- | -- | -- |
As of June 30, 2026.
Basic Info
| Investment Strategy | |
| The Fund seeks a high level of current income and secondarily, long-term capital appreciation. The Fund normally invests at least 80% of its net assets in debt securities and/or income producing securities. It may invest in debt securities of any maturity and credit quality, including securities below investment grade. |
| General | |
| Security Type | Unlisted Closed-End Fund |
| Equity Style | -- |
| Broad Asset Class | Taxable Bond |
| Broad Category | Fixed Income |
| Global Peer Group | Bond USD |
| Peer Group | General Bond Funds |
| Global Macro | Bond HC |
| US Macro | General Domestic Taxable Fixed Income Funds |
| YCharts Categorization | -- |
| YCharts Benchmark | -- |
| Prospectus Objective | General Bond Funds |
| Fund Owner Firm Name | Guardian |
| Broad Asset Class Benchmark Index | |
| ^BBUSATR | 100.0% |
Fundamentals
| General | |
| Distribution Yield | -- |
| Dividend Yield TTM (7-17-26) | 6.95% |
| 30-Day SEC Yield | -- |
| 7-Day SEC Yield | -- |
| Number of Holdings | 10 |
| Bond | |
| Yield to Maturity (10-31-25) | 6.65% |
| Effective Duration | 2.72 |
| Average Coupon | 7.92% |
| Calculated Average Quality | 3.700 |
| Effective Maturity | 9.991 |
| Nominal Maturity | 10.04 |
| Number of Bond Holdings | 8 |
As of October 31, 2025
Fund Details
| Key Dates | |
| Launch Date | 8/29/2014 |
| Last Annual Report Date | 7/31/2025 |
| Last Prospectus Date | 11/30/2024 |
| Attributes | |
| Index Fund | -- |
| Inverse Fund | No |
| Leveraged Fund |
|
| Fund of Funds | No |
| Currency Hedged Fund | -- |
| Socially Responsible Fund | No |
Top Portfolio Holders
| Name | % Weight |
|---|---|
| Portfolio A | 5.00% |
| Portfolio B | 3.50% |
| Portfolio C | 2.25% |