

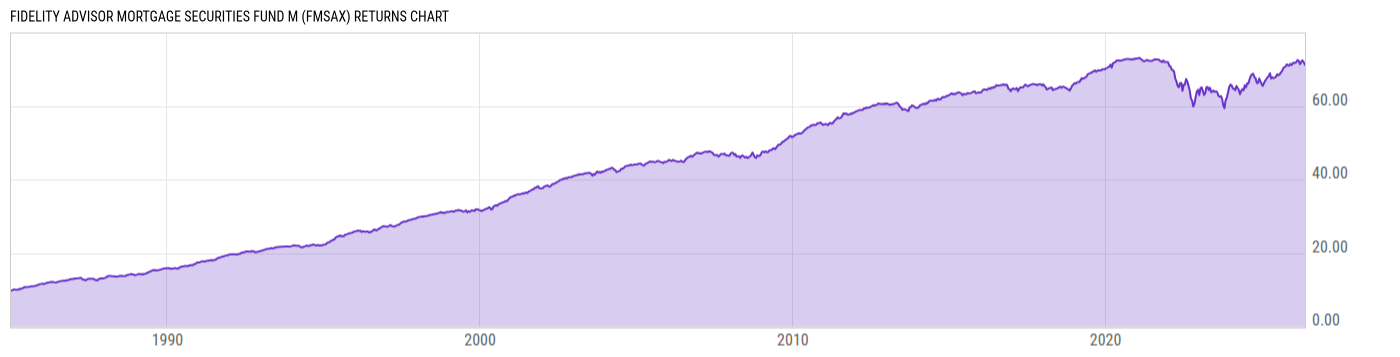
Fidelity Advisor Mortgage Securities Fund M (FMSAX)
9.89
+0.02
(+0.20%)
USD |
Jun 09 2026
Returns Chart
Key Stats
| Net Expense Ratio | Total Assets Under Management | Weighted Average Dividend Yield | Turnover Ratio (Generic) |
|---|---|---|---|
| 0.81% | 770.18M | -- | 652.0% |
| 1 Year Fund Level Flows | 1 Year Total Returns (Daily) | Annualized Total Returns Since Inception (Daily) | Max Drawdown (Since Inception) |
| 134.58M | 6.29% |
Basic Info
| Investment Strategy | |
| The Fund seeks a high level of current income, consistent with prudent investment risk. Under normal market and economic conditions, the Fund invests at least 80% of assets in investment-grade mortgage-related securities (those of medium and high quality) and repurchase agreements for those securities. |
| General | |
| Security Type | Mutual Fund |
| Equity Style | -- |
| Broad Asset Class | Taxable Bond |
| Broad Category | Fixed Income |
| Global Peer Group | Bond USD Mortgages |
| Peer Group | U.S. Mortgage Funds |
| Global Macro | Bond HC |
| US Macro | U.S. Government & Treasury Fixed Income Funds |
| YCharts Categorization | -- |
| YCharts Benchmark | -- |
| Prospectus Objective | U.S. Mortgage Funds |
| Fund Owner Firm Name | Fidelity Investments |
| Broad Asset Class Benchmark Index | |
| ^BBUSATR | 100.0% |
Net Fund Flows Versus Peer Group
1 Month
% Rank:
34
-105.93M
Peer Group Low
315.90M
Peer Group High
1 Year
% Rank:
27
134.58M
-2.129B
Peer Group Low
1.463B
Peer Group High
3 Months
% Rank:
30
-583.12M
Peer Group Low
530.19M
Peer Group High
3 Years
% Rank:
92
-6.769B
Peer Group Low
7.386B
Peer Group High
6 Months
% Rank:
26
-1.037B
Peer Group Low
1.036B
Peer Group High
5 Years
% Rank:
88
-18.17B
Peer Group Low
10.59B
Peer Group High
YTD
% Rank:
26
-615.00M
Peer Group Low
724.64M
Peer Group High
10 Years
% Rank:
76
-35.90B
Peer Group Low
25.97B
Peer Group High
Date Unavailable
Risk
Performance Versus Peer Group
Annual Total Returns Versus Peers
As of June 10, 2026.
Asset Allocation
As of April 30, 2026.
| Type | % Net |
|---|---|
| Cash | 2.58% |
| Stock | 0.00% |
| Bond | 97.92% |
| Convertible | 0.00% |
| Preferred | 0.00% |
| Other | -0.50% |
Top 10 Holdings
| Name | % Weight | Price | % Change |
|---|---|---|---|
|
Fidelity Cash Central Fund
|
7.46% | -- | -- |
|
Federal National Mortgage Association 2% 01-JUN-2056
|
5.62% | -- | -- |
|
Government National Mortgage Association 2 5.5% 01-JUN-2056
|
5.51% | -- | -- |
|
Federal National Mortgage Association 5% 01-MAY-2056
|
3.93% | -- | -- |
|
Government National Mortgage Association 2 6% 01-JUN-2056
|
2.42% | -- | -- |
|
Federal National Mortgage Association 2% 01-MAY-2056
|
1.77% | -- | -- |
|
Government National Mortgage Association 2 5.5% 01-MAY-2056
|
1.56% | -- | -- |
|
Federal National Mortgage Association 5% 01-MAY-2041
|
1.27% | -- | -- |
| United States of America USGB 3.5 02/15/2029 FIX USD Government | 1.26% | 98.29 | 0.09% |
| FHLMC-New 3.5 04/25/2052 FIX USD Agency | 1.14% | 91.24 | 0.16% |
Fees & Availability
| Fees | |
| Actual 12B-1 Fee | 0.25% |
| Actual Management Fee | 0.28% |
| Administration Fee | -- |
| Maximum Front Load | 4.00% |
| Maximum Deferred Load | -- |
| Maximum Redemption Fee | -- |
| General Availability | |
| Available for Insurance Product | No |
| Available for RRSP | No |
| Purchase Details | |
| Open to New Investors |
|
| Minimum Initial Investment | 0.00 None |
| Minimum Subsequent Investment | 0.00 None |
Basic Info
| Investment Strategy | |
| The Fund seeks a high level of current income, consistent with prudent investment risk. Under normal market and economic conditions, the Fund invests at least 80% of assets in investment-grade mortgage-related securities (those of medium and high quality) and repurchase agreements for those securities. |
| General | |
| Security Type | Mutual Fund |
| Equity Style | -- |
| Broad Asset Class | Taxable Bond |
| Broad Category | Fixed Income |
| Global Peer Group | Bond USD Mortgages |
| Peer Group | U.S. Mortgage Funds |
| Global Macro | Bond HC |
| US Macro | U.S. Government & Treasury Fixed Income Funds |
| YCharts Categorization | -- |
| YCharts Benchmark | -- |
| Prospectus Objective | U.S. Mortgage Funds |
| Fund Owner Firm Name | Fidelity Investments |
| Broad Asset Class Benchmark Index | |
| ^BBUSATR | 100.0% |
Fundamentals
| General | |
| Distribution Yield | -- |
| Dividend Yield TTM (6-8-26) | 3.58% |
| 30-Day SEC Yield (5-31-26) | 3.60% |
| 7-Day SEC Yield | -- |
| Number of Holdings | 1726 |
| Bond | |
| Yield to Maturity (4-30-26) | 4.77% |
| Effective Duration | 5.33 |
| Average Coupon | 4.23% |
| Calculated Average Quality | 1.119 |
| Effective Maturity | 23.98 |
| Nominal Maturity | 23.98 |
| Number of Bond Holdings | 1549 |
As of April 30, 2026
Fund Details
Top Portfolio Holders
| Name | % Weight |
|---|---|
| Portfolio A | 5.00% |
| Portfolio B | 3.50% |
| Portfolio C | 2.25% |
Excel Add-In Codes
| Name: =YCI("M:FMSAX", "name") |
| Broad Asset Class: =YCI("M:FMSAX", "broad_asset_class") |
| Broad Category: =YCI("M:FMSAX", "broad_category_group") |
| Prospectus Objective: =YCI("M:FMSAX", "prospectus_objective") |
| To find the codes for any of our securities and financial metrics, see our Complete Excel Reference. |