

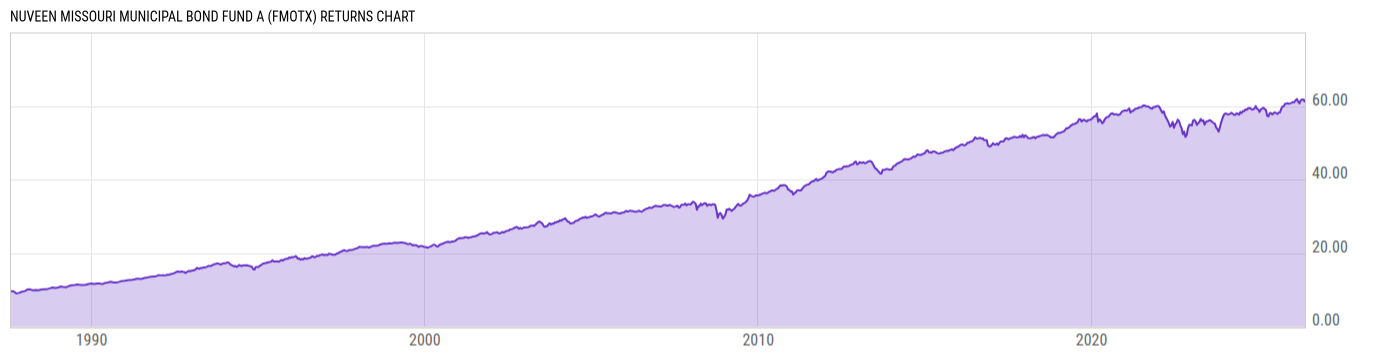
Nuveen Missouri Municipal Bond Fund A (FMOTX)
10.41
+0.01
(+0.10%)
USD |
May 27 2026
Returns Chart
Key Stats
| Net Expense Ratio | Total Assets Under Management | Weighted Average Dividend Yield | Turnover Ratio (Generic) |
|---|---|---|---|
| 0.77% | 507.10M | -- | 14.00% |
| 1 Year Fund Level Flows | 1 Year Total Returns (Daily) | Annualized Total Returns Since Inception (Daily) | Max Drawdown (Since Inception) |
| -15.59M | 6.37% |
Basic Info
| Investment Strategy | |
| The Fund seeks a high level of current interest income exempt from regular federal, Missouri State and, in some cases, Missouri local income taxes. The Fund invests at least 80% of its net assets in municipal bonds that pay interest that is exempt from regular federal and Missouri personal income tax. |
| General | |
| Security Type | Mutual Fund |
| Equity Style | -- |
| Broad Asset Class | Municipal Bond |
| Broad Category | Fixed Income |
| Global Peer Group | Bond USD Municipal |
| Peer Group | Other States Municipal Debt Funds |
| Global Macro | Bond HC |
| US Macro | Single State Municipal Debt Funds |
| YCharts Categorization | -- |
| YCharts Benchmark | -- |
| Prospectus Objective | Other States Municipal Debt Funds |
| Fund Owner Firm Name | Nuveen |
| Broad Asset Class Benchmark Index | |
| ^BBMBTR | 100.0% |
Net Fund Flows Versus Peer Group
1 Month
% Rank:
97
-5.219M
Peer Group Low
7.355M
Peer Group High
1 Year
% Rank:
68
-15.59M
-107.55M
Peer Group Low
80.75M
Peer Group High
3 Months
% Rank:
39
-22.47M
Peer Group Low
35.95M
Peer Group High
3 Years
% Rank:
67
-242.02M
Peer Group Low
97.16M
Peer Group High
6 Months
% Rank:
64
-56.53M
Peer Group Low
40.25M
Peer Group High
5 Years
% Rank:
77
-490.31M
Peer Group Low
109.19M
Peer Group High
YTD
% Rank:
37
-26.92M
Peer Group Low
39.70M
Peer Group High
10 Years
% Rank:
44
-590.12M
Peer Group Low
524.63M
Peer Group High
Date Unavailable
Risk
Performance Versus Peer Group
Annual Total Returns Versus Peers
As of May 28, 2026.
Asset Allocation
As of April 30, 2026.
| Type | % Net |
|---|---|
| Cash | 0.01% |
| Stock | 0.00% |
| Bond | 99.78% |
| Convertible | 0.00% |
| Preferred | 0.00% |
| Other | 0.22% |
Top 10 Holdings
| Name | % Weight | Price | % Change |
|---|---|---|---|
| KANSAS CITY MO INDL DEV AUTH ARPT SPL OBLIG MO 5.000 03/01/2054 | 2.81% | 100.15 | 0.08% |
| METROPOLITAN ST LOUIS MO SWR DIST WASTEWTR SYS REV MO 5.000 05/01/2047 | 1.99% | 100.58 | 0.02% |
| MISSOURI ST HEALTH & EDL FACS AUTH EDL FACS REV MO 5.000 10/01/2046 | 1.95% | 101.96 | 0.05% |
| MISSOURI ST HEALTH & EDL FACS AUTH HEALTH FACS REV MO 4.000 04/01/2045 | 1.84% | 93.76 | 0.26% |
| MISSOURI ST DEV FIN BRD SOLID WASTE DISP REV MO 5.200 03/15/2029 | 1.84% | 105.08 | 0.05% |
| MISSOURI ST HEALTH & EDL FACS AUTH HEALTH FACS REV MO 5.000 11/15/2035 | 1.64% | 100.13 | 0.00% |
| MISSOURI ST HEALTH & EDL FACS AUTH HEALTH FACS REV MO 4.000 02/15/2054 | 1.51% | 84.92 | 0.45% |
| MISSOURI ST HEALTH & EDL FACS AUTH HEALTH FACS REV MO 4.000 07/01/2046 | 1.41% | 92.86 | 0.26% |
| KANSAS CITY MO INDL DEV AUTH ARPT SPL OBLIG MO 5.000 03/01/2044 | 1.40% | 101.47 | 0.05% |
| KANSAS CITY MO WTR REV MO 5.000 12/01/2048 | 1.39% | 105.31 | 0.13% |
Fees & Availability
| Fees | |
| Actual 12B-1 Fee | 0.20% |
| Actual Management Fee | 0.49% |
| Administration Fee | -- |
| Maximum Front Load | 4.20% |
| Maximum Deferred Load | -- |
| Maximum Redemption Fee | -- |
| General Availability | |
| Available for Insurance Product | No |
| Available for RRSP | No |
| Purchase Details | |
| Open to New Investors |
|
| Minimum Initial Investment | 2500.00 None |
| Minimum Subsequent Investment | 100.00 None |
Basic Info
| Investment Strategy | |
| The Fund seeks a high level of current interest income exempt from regular federal, Missouri State and, in some cases, Missouri local income taxes. The Fund invests at least 80% of its net assets in municipal bonds that pay interest that is exempt from regular federal and Missouri personal income tax. |
| General | |
| Security Type | Mutual Fund |
| Equity Style | -- |
| Broad Asset Class | Municipal Bond |
| Broad Category | Fixed Income |
| Global Peer Group | Bond USD Municipal |
| Peer Group | Other States Municipal Debt Funds |
| Global Macro | Bond HC |
| US Macro | Single State Municipal Debt Funds |
| YCharts Categorization | -- |
| YCharts Benchmark | -- |
| Prospectus Objective | Other States Municipal Debt Funds |
| Fund Owner Firm Name | Nuveen |
| Broad Asset Class Benchmark Index | |
| ^BBMBTR | 100.0% |
Fundamentals
| General | |
| Distribution Yield | -- |
| Dividend Yield TTM (5-26-26) | 3.53% |
| 30-Day SEC Yield (4-30-26) | 3.27% |
| 7-Day SEC Yield | -- |
| Number of Holdings | 10 |
| Bond | |
| Yield to Maturity (4-30-26) | 4.11% |
| Effective Duration | 7.97 |
| Average Coupon | 4.76% |
| Calculated Average Quality | 2.600 |
| Effective Maturity | 9.107 |
| Nominal Maturity | 17.06 |
| Number of Bond Holdings | 10 |
As of April 30, 2026
Fund Details
Top Portfolio Holders
| Name | % Weight |
|---|---|
| Portfolio A | 5.00% |
| Portfolio B | 3.50% |
| Portfolio C | 2.25% |
Excel Add-In Codes
| Name: =YCI("M:FMOTX", "name") |
| Broad Asset Class: =YCI("M:FMOTX", "broad_asset_class") |
| Broad Category: =YCI("M:FMOTX", "broad_category_group") |
| Prospectus Objective: =YCI("M:FMOTX", "prospectus_objective") |
| To find the codes for any of our securities and financial metrics, see our Complete Excel Reference. |