

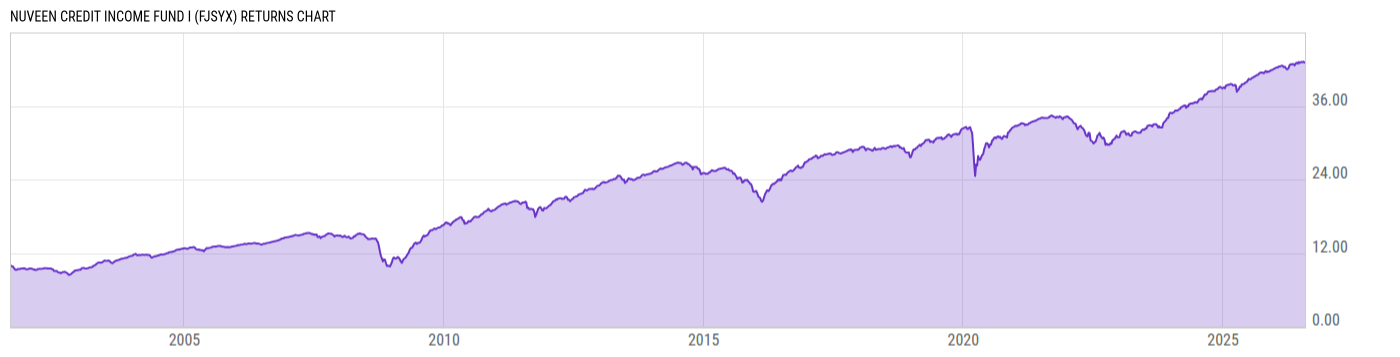
Nuveen Credit Income Fund I (FJSYX)
6.59
0.00 (0.00%)
USD |
Jul 31 2026
Returns Chart
Key Stats
| Net Expense Ratio | Total Assets Under Management | Weighted Average Dividend Yield | Turnover Ratio (Generic) |
|---|---|---|---|
| 0.71% | 374.98M | -- | 99.00% |
| 1 Year Fund Level Flows | 1 Year Total Returns (Daily) | Annualized Total Returns Since Inception (Daily) | Max Drawdown (Since Inception) |
| 153.40M | 6.11% |
Basic Info
| Investment Strategy | |
| The Fund seeks to provide total return, with an emphasis on a high level of current income. Under normal circumstances, the Fund invests in credit and credit-related instruments. The Fund will invest at least 65% of its net assets in securities rated lower than investment grade at the time of purchase. |
| General | |
| Security Type | Mutual Fund |
| Equity Style | -- |
| Broad Asset Class | Taxable Bond |
| Broad Category | Fixed Income |
| Global Peer Group | Bond USD High Yield |
| Peer Group | High Yield Funds |
| Global Macro | Bond High Yield |
| US Macro | High Yield Funds |
| YCharts Categorization | -- |
| YCharts Benchmark | -- |
| Prospectus Objective | High Yield Funds |
| Fund Owner Firm Name | Nuveen |
| Broad Asset Class Benchmark Index | |
| ^BBUSATR | 100.0% |
Net Fund Flows Versus Peer Group
1 Month
% Rank:
83
-459.31M
Peer Group Low
333.31M
Peer Group High
1 Year
% Rank:
16
153.40M
-2.912B
Peer Group Low
2.384B
Peer Group High
3 Months
% Rank:
82
-2.604B
Peer Group Low
2.240B
Peer Group High
3 Years
% Rank:
17
-4.343B
Peer Group Low
15.04B
Peer Group High
6 Months
% Rank:
20
-2.720B
Peer Group Low
2.581B
Peer Group High
5 Years
% Rank:
14
-6.771B
Peer Group Low
16.33B
Peer Group High
YTD
% Rank:
17
-2.959B
Peer Group Low
2.670B
Peer Group High
10 Years
% Rank:
40
-9.741B
Peer Group Low
11.02B
Peer Group High
Date Unavailable
Risk
Performance Versus Peer Group
Annual Total Returns Versus Peers
As of August 02, 2026.
Asset Allocation
As of May 31, 2026.
| Type | % Net |
|---|---|
| Cash | 3.07% |
| Stock | 0.35% |
| Bond | 96.99% |
| Convertible | 0.00% |
| Preferred | 0.57% |
| Other | -0.98% |
Top 10 Holdings
| Name | % Weight | Price | % Change |
|---|---|---|---|
|
Fixed Income Clearing Corp Repo
|
2.72% | -- | -- |
|
State Street Navigator Securities Lending Government Money Market Portfolio
|
2.63% | -- | -- |
|
Allied Universal Holdco LLC 05-AUG-2032 Term Loan B
|
0.76% | -- | -- |
|
OHS ISSUER LLC 261 B FIX 8.35% 25-FEB-2061
|
0.75% | -- | -- |
|
ILPT COMMERCIAL MORTGAGE TRUST 25LPF2 E SEQ VAR 8.4723% 15-JUL-2042
|
0.65% | -- | -- |
| Encore Capital Group, Inc. ECGI 6.625 06/01/2032 FIX USD Corporate 144A | 0.64% | 100.27 | 0.06% |
| TSC SPV FUNDING, LLC TSCSPV 8.905 05/20/2056 FIX USD Corporate 144A | 0.64% | 99.34 | 0.11% |
|
CONNECTICUT AVENUE SECURITIES TRUST 22R06 1B2 FLT 14.22776% 27-MAY-2042
|
0.55% | -- | -- |
| CONNECT HOLDING II LLC CONNHOAD 10.5 04/03/2031 FIX USD Corporate 144A | 0.55% | 97.98 | 0.10% |
|
FREDDIE MAC STACR REMIC TRUST 22DNA3 B2 FLT 13.3621% 25-APR-2042
|
0.54% | -- | -- |
Fees & Availability
| Fees | |
| Actual 12B-1 Fee | -- |
| Actual Management Fee | 0.45% |
| Administration Fee | -- |
| Maximum Front Load | -- |
| Maximum Deferred Load | -- |
| Maximum Redemption Fee | -- |
| General Availability | |
| Available for Insurance Product | No |
| Available for RRSP | No |
| Purchase Details | |
| Open to New Investors |
|
| Minimum Initial Investment | 100000.0 None |
| Minimum Subsequent Investment | 0.00 None |
Projected Income
| Type | Aug | Sep | Oct | Nov | Dec | Jan | Feb | Mar | Apr | May | Jun | Jul |
|---|---|---|---|---|---|---|---|---|---|---|---|---|
|
Qualified Income
|
-- | -- | -- | -- | -- | -- | -- | -- | -- | -- | -- | -- |
|
Normal
|
-- | -- | -- | -- | -- | -- | -- | -- | -- | -- | -- | -- |
|
Qualified
|
-- | -- | -- | -- | -- | -- | -- | -- | -- | -- | -- | -- |
|
LT Cap Gains
|
-- | -- | -- | -- | -- | -- | -- | -- | -- | -- | -- | -- |
|
Ordinary Income
|
-- | -- | -- | -- | -- | -- | -- | -- | -- | -- | -- | -- |
|
Non-Qual
|
-- | -- | -- | -- | -- | -- | -- | -- | -- | -- | -- | -- |
|
ST Cap Gains
|
-- | -- | -- | -- | -- | -- | -- | -- | -- | -- | -- | -- |
|
Interest
|
-- | -- | -- | -- | -- | -- | -- | -- | -- | -- | -- | -- |
|
Tax-Exempt
|
-- | -- | -- | -- | -- | -- | -- | -- | -- | -- | -- | -- |
|
ROC
|
-- | -- | -- | -- | -- | -- | -- | -- | -- | -- | -- | -- |
|
Other
|
-- | -- | -- | -- | -- | -- | -- | -- | -- | -- | -- | -- |
|
Total
|
-- | -- | -- | -- | -- | -- | -- | -- | -- | -- | -- | -- |
As of July 31, 2026.
Basic Info
| Investment Strategy | |
| The Fund seeks to provide total return, with an emphasis on a high level of current income. Under normal circumstances, the Fund invests in credit and credit-related instruments. The Fund will invest at least 65% of its net assets in securities rated lower than investment grade at the time of purchase. |
| General | |
| Security Type | Mutual Fund |
| Equity Style | -- |
| Broad Asset Class | Taxable Bond |
| Broad Category | Fixed Income |
| Global Peer Group | Bond USD High Yield |
| Peer Group | High Yield Funds |
| Global Macro | Bond High Yield |
| US Macro | High Yield Funds |
| YCharts Categorization | -- |
| YCharts Benchmark | -- |
| Prospectus Objective | High Yield Funds |
| Fund Owner Firm Name | Nuveen |
| Broad Asset Class Benchmark Index | |
| ^BBUSATR | 100.0% |
Fundamentals
| General | |
| Distribution Yield | -- |
| Dividend Yield TTM (7-31-26) | 7.08% |
| 30-Day SEC Yield (6-30-26) | 6.69% |
| 7-Day SEC Yield | -- |
| Number of Holdings | 10 |
| Bond | |
| Yield to Maturity (5-31-26) | 6.87% |
| Effective Duration | 2.92 |
| Average Coupon | 7.51% |
| Calculated Average Quality | 5.496 |
| Effective Maturity | 9.030 |
| Nominal Maturity | 9.741 |
| Number of Bond Holdings | 8 |
As of May 31, 2026
Fund Details
Top Portfolio Holders
| Name | % Weight |
|---|---|
| Portfolio A | 5.00% |
| Portfolio B | 3.50% |
| Portfolio C | 2.25% |
Excel Add-In Codes
| Name: =YCI("M:FJSYX", "name") |
| Broad Asset Class: =YCI("M:FJSYX", "broad_asset_class") |
| Broad Category: =YCI("M:FJSYX", "broad_category_group") |
| Prospectus Objective: =YCI("M:FJSYX", "prospectus_objective") |
| To find the codes for any of our securities and financial metrics, see our Complete Excel Reference. |