

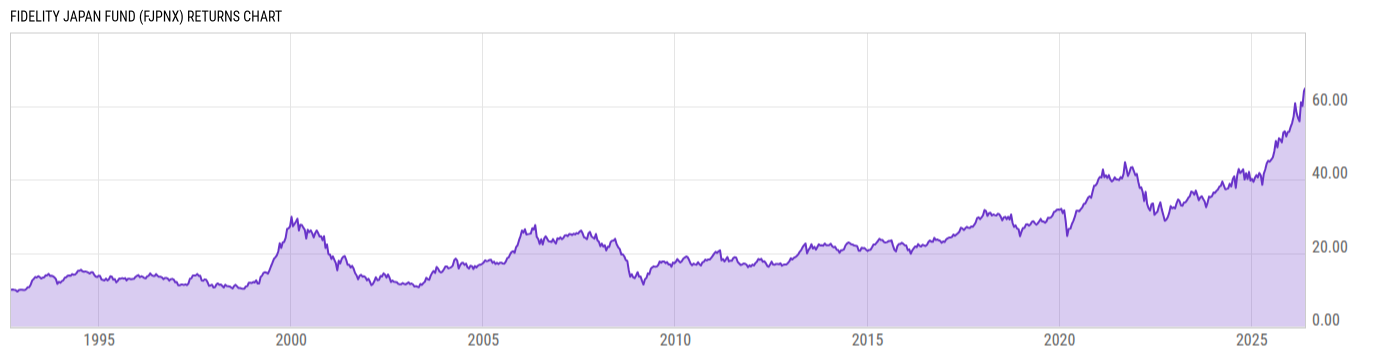
Fidelity Japan Fund (FJPNX)
23.63
-0.40
(-1.66%)
USD |
Jun 09 2026
Returns Chart
Key Stats
| Net Expense Ratio | Total Assets Under Management | Weighted Average Dividend Yield | Turnover Ratio (Generic) |
|---|---|---|---|
| 0.74% | 1.037B | 1.54% | -- |
| 1 Year Fund Level Flows | 1 Year Total Returns (Daily) | Annualized Total Returns Since Inception (Daily) | Max Drawdown (Since Inception) |
| 17.70M | 38.45% |
Basic Info
| Investment Strategy | |
| The Fund seeks long-term capital growth from a portfolio of securities primarily of small and medium-sized Japanese companies listed or traded on Japanese stock markets. The Fund normally invests at least 80% of its assets in securities of Japanese issuers and other investments that are tied economically to Japan. |
| General | |
| Security Type | Mutual Fund |
| Equity Style | Multi Cap Growth |
| Broad Asset Class | International Equity |
| Broad Category | Equity |
| Global Peer Group | Equity Japan |
| Peer Group | Japanese Funds |
| Global Macro | Equity Asia Pacific |
| US Macro | Developed International Markets Funds |
| YCharts Categorization | -- |
| YCharts Benchmark | -- |
| Prospectus Objective | Japanese Funds |
| Fund Owner Firm Name | Fidelity Investments |
| Broad Asset Class Benchmark Index | |
| ^MSACXUSNTR | 100.0% |
Net Fund Flows Versus Peer Group
1 Month
% Rank:
39
-518.88M
Peer Group Low
279.84M
Peer Group High
1 Year
% Rank:
55
17.70M
-267.51M
Peer Group Low
1.754B
Peer Group High
3 Months
% Rank:
30
-67.36M
Peer Group Low
1.088B
Peer Group High
3 Years
% Rank:
76
-646.81M
Peer Group Low
2.720B
Peer Group High
6 Months
% Rank:
67
-101.13M
Peer Group Low
2.875B
Peer Group High
5 Years
% Rank:
71
-965.01M
Peer Group Low
2.832B
Peer Group High
YTD
% Rank:
37
-101.03M
Peer Group Low
3.241B
Peer Group High
10 Years
% Rank:
69
-7.799B
Peer Group Low
10.05B
Peer Group High
Date Unavailable
Risk
Performance Versus Peer Group
Annual Total Returns Versus Peers
As of June 10, 2026.
Asset Allocation
As of April 30, 2026.
| Type | % Net |
|---|---|
| Cash | 0.02% |
| Stock | 97.92% |
| Bond | 0.04% |
| Convertible | 0.00% |
| Preferred | 0.00% |
| Other | 2.02% |
Top 10 Holdings
| Name | % Weight | Price | % Change |
|---|---|---|---|
| Sumitomo Mitsui Financial Group, Inc. | 5.34% | 38.83 | 0.89% |
| Hitachi Ltd. | 3.77% | 30.05 | -9.06% |
| Toyota Motor Corp. | 3.30% | 17.50 | -2.23% |
| Renesas Electronics Corp. | 2.80% | 27.15 | -2.86% |
| Kioxia Holdings Corp. | 2.66% | 457.23 | -5.90% |
| HOYA Corp. | 2.52% | 170.92 | 0.00% |
| Mizuho Financial Group, Inc. | 2.49% | 47.21 | -1.85% |
| Furukawa Electric Co., Ltd. | 2.33% | 315.00 | 0.00% |
| ORIX Corp. | 2.22% | 36.75 | -3.90% |
| Chugai Pharmaceutical Co., Ltd. | 2.16% | 45.87 | -2.26% |
Fees & Availability
| Fees | |
| Actual 12B-1 Fee | -- |
| Actual Management Fee | 0.71% |
| Administration Fee | -- |
| Maximum Front Load | 0.00% |
| Maximum Deferred Load | -- |
| Maximum Redemption Fee | 0.00% |
| General Availability | |
| Available for Insurance Product | No |
| Available for RRSP | No |
| Purchase Details | |
| Open to New Investors |
|
| Minimum Initial Investment | 0.00 None |
| Minimum Subsequent Investment | 0.00 None |
Basic Info
| Investment Strategy | |
| The Fund seeks long-term capital growth from a portfolio of securities primarily of small and medium-sized Japanese companies listed or traded on Japanese stock markets. The Fund normally invests at least 80% of its assets in securities of Japanese issuers and other investments that are tied economically to Japan. |
| General | |
| Security Type | Mutual Fund |
| Equity Style | Multi Cap Growth |
| Broad Asset Class | International Equity |
| Broad Category | Equity |
| Global Peer Group | Equity Japan |
| Peer Group | Japanese Funds |
| Global Macro | Equity Asia Pacific |
| US Macro | Developed International Markets Funds |
| YCharts Categorization | -- |
| YCharts Benchmark | -- |
| Prospectus Objective | Japanese Funds |
| Fund Owner Firm Name | Fidelity Investments |
| Broad Asset Class Benchmark Index | |
| ^MSACXUSNTR | 100.0% |
Fundamentals
| General | |
| Distribution Yield | -- |
| Dividend Yield TTM (6-8-26) | 3.80% |
| 30-Day SEC Yield (10-3-23) | 0.00% |
| 7-Day SEC Yield (10-3-23) | 0.00% |
| Number of Holdings | 93 |
| Stock | |
| Weighted Average PE Ratio | 28.38 |
| Weighted Average Price to Sales Ratio | 3.599 |
| Weighted Average Price to Book Ratio | 3.990 |
| Weighted Median ROE | 12.99% |
| Weighted Median ROA | 6.27% |
| ROI (TTM) | 10.09% |
| Return on Investment (TTM) | 10.09% |
| Earning Yield | 0.0495 |
| LT Debt / Shareholders Equity | 0.4568 |
| Number of Equity Holdings | 91 |
As of April 30, 2026
Growth Metrics
| EPS Growth (1Y) | 22.04% |
| EPS Growth (3Y) | 15.97% |
| EPS Growth (5Y) | 19.98% |
| Sales Growth (1Y) | 8.59% |
| Sales Growth (3Y) | 8.19% |
| Sales Growth (5Y) | 11.26% |
| Sales per Share Growth (1Y) | 9.45% |
| Sales per Share Growth (3Y) | 8.75% |
| Operating Cash Flow - Growth Rate (3Y) | 15.06% |
As of April 30, 2026
Fund Details
Top Portfolio Holders
| Name | % Weight |
|---|---|
| Portfolio A | 5.00% |
| Portfolio B | 3.50% |
| Portfolio C | 2.25% |
Excel Add-In Codes
| Name: =YCI("M:FJPNX", "name") |
| Broad Asset Class: =YCI("M:FJPNX", "broad_asset_class") |
| Broad Category: =YCI("M:FJPNX", "broad_category_group") |
| Prospectus Objective: =YCI("M:FJPNX", "prospectus_objective") |
| To find the codes for any of our securities and financial metrics, see our Complete Excel Reference. |