

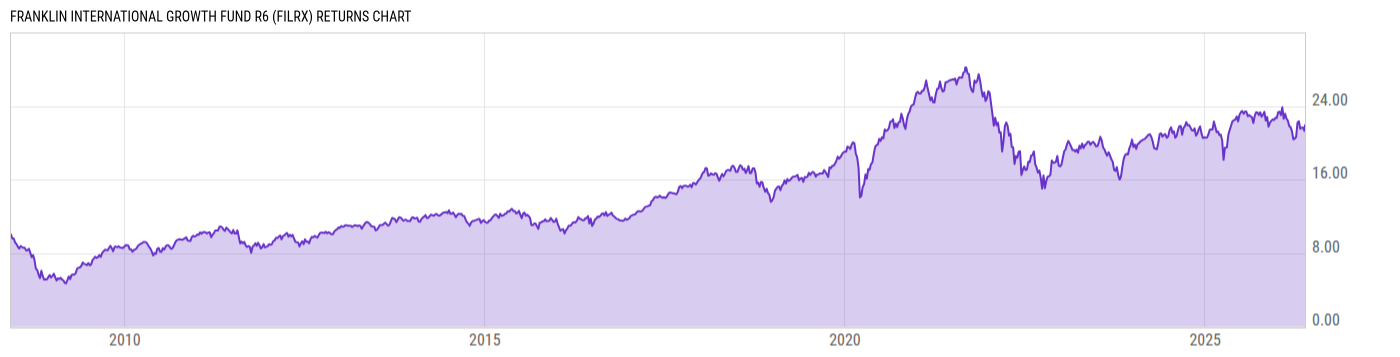
Franklin International Growth Fund R6 (FILRX)
17.00
+0.03
(+0.18%)
USD |
May 22 2026
Returns Chart
Key Stats
| Net Expense Ratio | Total Assets Under Management | Weighted Average Dividend Yield | Turnover Ratio (Generic) |
|---|---|---|---|
| 0.76% | 635.42M | 1.51% | 26.00% |
| 1 Year Fund Level Flows | 1 Year Total Returns (Daily) | Annualized Total Returns Since Inception (Daily) | Max Drawdown (Since Inception) |
| -230.32M | -0.96% |
Basic Info
| Investment Strategy | |
| The Fund seeks long-term capital appreciation. The Fund seeks to invest predominantly in equity securities of mid- large-capitalization companies located outside the U.S., including developing or emerging market countries. |
| General | |
| Security Type | Mutual Fund |
| Equity Style | Multi Cap Growth |
| Broad Asset Class | International Equity |
| Broad Category | Equity |
| Global Peer Group | Equity Global ex US |
| Peer Group | International Multi-Cap Growth |
| Global Macro | Equity Global |
| US Macro | Developed International Markets Funds |
| YCharts Categorization | -- |
| YCharts Benchmark | -- |
| Prospectus Objective | International Funds |
| Fund Owner Firm Name | Franklin Templeton |
| Broad Asset Class Benchmark Index | |
| ^MSACXUSNTR | 100.0% |
Net Fund Flows Versus Peer Group
1 Month
% Rank:
62
-736.26M
Peer Group Low
1.160B
Peer Group High
1 Year
% Rank:
58
-230.32M
-5.143B
Peer Group Low
8.703B
Peer Group High
3 Months
% Rank:
62
-2.000B
Peer Group Low
1.753B
Peer Group High
3 Years
% Rank:
66
-8.888B
Peer Group Low
26.37B
Peer Group High
6 Months
% Rank:
53
-3.722B
Peer Group Low
3.668B
Peer Group High
5 Years
% Rank:
70
-8.856B
Peer Group Low
31.65B
Peer Group High
YTD
% Rank:
56
-2.625B
Peer Group Low
1.737B
Peer Group High
10 Years
% Rank:
47
-26.31B
Peer Group Low
41.58B
Peer Group High
Date Unavailable
Risk
Performance Versus Peer Group
Annual Total Returns Versus Peers
As of May 24, 2026.
Asset Allocation
As of March 31, 2026.
| Type | % Net |
|---|---|
| Cash | 0.07% |
| Stock | 98.17% |
| Bond | 0.00% |
| Convertible | 0.00% |
| Preferred | 0.00% |
| Other | 1.76% |
Top 10 Holdings
| Name | % Weight | Price | % Change |
|---|---|---|---|
| Lonza Group AG | 4.21% | 625.45 | -3.06% |
| DSV A/S | 3.96% | 239.58 | 2.36% |
| MTU Aero Engines AG | 3.88% | 348.39 | 2.27% |
| AstraZeneca PLC | 3.75% | 187.03 | -1.43% |
| argenx SE | 3.74% | 806.46 | -1.20% |
| Alcon AG | 3.53% | 67.78 | -0.22% |
| Secure Waste Infrastructure Corp. | 3.45% | 15.42 | -1.70% |
| FinecoBank SpA | 3.43% | 22.80 | 0.00% |
| Exosens SA | 3.32% | 51.55 | 0.00% |
| Fast Retailing Co., Ltd. | 3.30% | 497.36 | 7.83% |
Fees & Availability
| Fees | |
| Actual 12B-1 Fee | -- |
| Actual Management Fee | 0.67% |
| Administration Fee | -- |
| Maximum Front Load | -- |
| Maximum Deferred Load | -- |
| Maximum Redemption Fee | -- |
| General Availability | |
| Available for Insurance Product | No |
| Available for RRSP | No |
| Purchase Details | |
| Open to New Investors |
|
| Minimum Initial Investment | 1.00M None |
| Minimum Subsequent Investment | 0.00 None |
Basic Info
| Investment Strategy | |
| The Fund seeks long-term capital appreciation. The Fund seeks to invest predominantly in equity securities of mid- large-capitalization companies located outside the U.S., including developing or emerging market countries. |
| General | |
| Security Type | Mutual Fund |
| Equity Style | Multi Cap Growth |
| Broad Asset Class | International Equity |
| Broad Category | Equity |
| Global Peer Group | Equity Global ex US |
| Peer Group | International Multi-Cap Growth |
| Global Macro | Equity Global |
| US Macro | Developed International Markets Funds |
| YCharts Categorization | -- |
| YCharts Benchmark | -- |
| Prospectus Objective | International Funds |
| Fund Owner Firm Name | Franklin Templeton |
| Broad Asset Class Benchmark Index | |
| ^MSACXUSNTR | 100.0% |
Fundamentals
| General | |
| Distribution Yield | -- |
| Dividend Yield TTM (5-21-26) | 0.70% |
| 30-Day SEC Yield (3-31-23) | 0.36% |
| 7-Day SEC Yield | -- |
| Number of Holdings | 41 |
| Stock | |
| Weighted Average PE Ratio | 32.77 |
| Weighted Average Price to Sales Ratio | 5.366 |
| Weighted Average Price to Book Ratio | 6.263 |
| Weighted Median ROE | 19.90% |
| Weighted Median ROA | 8.89% |
| ROI (TTM) | 14.43% |
| Return on Investment (TTM) | 14.43% |
| Earning Yield | 0.0400 |
| LT Debt / Shareholders Equity | 0.3917 |
| Number of Equity Holdings | 35 |
As of March 31, 2026
Growth Metrics
| EPS Growth (1Y) | 12.01% |
| EPS Growth (3Y) | 16.16% |
| EPS Growth (5Y) | 22.03% |
| Sales Growth (1Y) | 14.60% |
| Sales Growth (3Y) | 11.95% |
| Sales Growth (5Y) | 19.49% |
| Sales per Share Growth (1Y) | 10.86% |
| Sales per Share Growth (3Y) | 19.07% |
| Operating Cash Flow - Growth Rate (3Y) | 13.10% |
As of March 31, 2026
Fund Details
Top Portfolio Holders
| Name | % Weight |
|---|---|
| Portfolio A | 5.00% |
| Portfolio B | 3.50% |
| Portfolio C | 2.25% |
Excel Add-In Codes
| Name: =YCI("M:FILRX", "name") |
| Broad Asset Class: =YCI("M:FILRX", "broad_asset_class") |
| Broad Category: =YCI("M:FILRX", "broad_category_group") |
| Prospectus Objective: =YCI("M:FILRX", "prospectus_objective") |
| To find the codes for any of our securities and financial metrics, see our Complete Excel Reference. |