

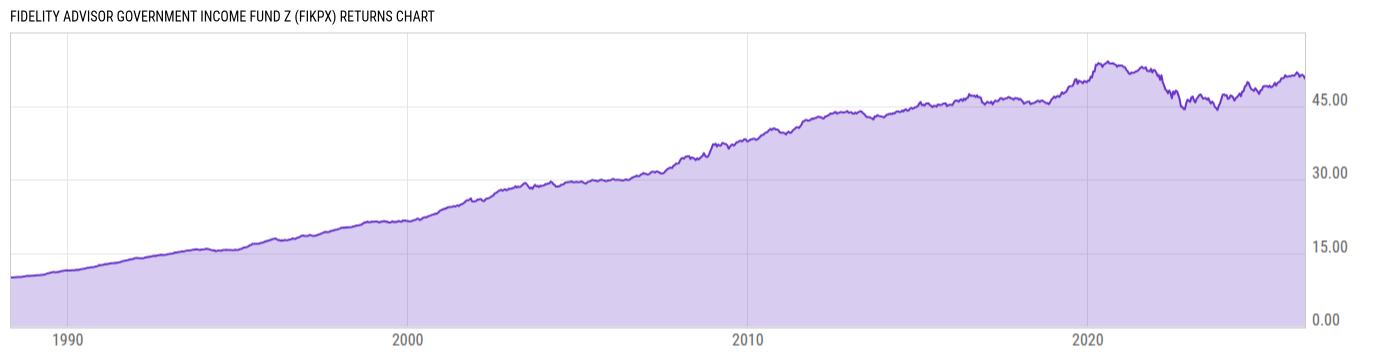
Fidelity Advisor Government Income Fund Z (FIKPX)
9.14
+0.02
(+0.22%)
USD |
Jun 09 2026
Returns Chart
Key Stats
| Net Expense Ratio | Total Assets Under Management | Weighted Average Dividend Yield | Turnover Ratio (Generic) |
|---|---|---|---|
| 0.36% | 1.403B | -- | 279.0% |
| 1 Year Fund Level Flows | 1 Year Total Returns (Daily) | Annualized Total Returns Since Inception (Daily) | Max Drawdown (Since Inception) |
| -553.03M | 4.52% |
Basic Info
| Investment Strategy | |
| The Fund seeks a high level of current income with preservation of capital by investing at least 80% of assets in US government securities, and in instruments related to same. The Fund is managed to have the similar overall interest rate risk to the Barclays Capital Government Bond Index. |
| General | |
| Security Type | Mutual Fund |
| Equity Style | -- |
| Broad Asset Class | Taxable Bond |
| Broad Category | Fixed Income |
| Global Peer Group | Bond USD Government |
| Peer Group | General U.S. Government Funds |
| Global Macro | Bond Government |
| US Macro | U.S. Government & Treasury Fixed Income Funds |
| YCharts Categorization | -- |
| YCharts Benchmark | -- |
| Prospectus Objective | General U.S. Government Funds |
| Fund Owner Firm Name | Fidelity Investments |
| Broad Asset Class Benchmark Index | |
| ^BBUSATR | 100.0% |
Net Fund Flows Versus Peer Group
1 Month
% Rank:
97
-25.32M
Peer Group Low
199.39M
Peer Group High
1 Year
% Rank:
97
-553.03M
-553.03M
Peer Group Low
844.39M
Peer Group High
3 Months
% Rank:
97
-126.15M
Peer Group Low
26.15M
Peer Group High
3 Years
% Rank:
97
-2.253B
Peer Group Low
2.274B
Peer Group High
6 Months
% Rank:
95
-248.12M
Peer Group Low
445.04M
Peer Group High
5 Years
% Rank:
97
-2.067B
Peer Group Low
3.211B
Peer Group High
YTD
% Rank:
97
-153.55M
Peer Group Low
355.14M
Peer Group High
10 Years
% Rank:
97
-3.426B
Peer Group Low
13.80B
Peer Group High
Date Unavailable
Risk
Performance Versus Peer Group
Annual Total Returns Versus Peers
As of June 10, 2026.
Asset Allocation
As of April 30, 2026.
| Type | % Net |
|---|---|
| Cash | 0.01% |
| Stock | 0.00% |
| Bond | 99.55% |
| Convertible | 0.00% |
| Preferred | 0.00% |
| Other | 0.43% |
Top 10 Holdings
| Name | % Weight | Price | % Change |
|---|---|---|---|
|
Other Assets less Liabilities
|
21.19% | -- | -- |
| United States of America USGB 4.0 11/15/2035 FIX USD Government | 9.01% | 96.07 | 0.30% |
| United States of America USGB 3.5 02/15/2029 FIX USD Government | 8.20% | 98.29 | 0.09% |
| United States of America USGB 3.5 03/15/2029 FIX USD Government | 7.82% | 98.26 | 0.09% |
| United States of America USGB 4.375 08/15/2043 FIX USD Government | 5.69% | 93.13 | 0.48% |
| United States of America USGB 3.0 02/15/2049 FIX USD Government | 4.14% | 72.05 | 0.63% |
| United States of America USGB 3.625 02/15/2053 FIX USD Government | 3.07% | 79.06 | 0.63% |
| United States of America USGB 3.875 04/15/2029 FIX USD Government | 2.65% | 99.19 | 0.09% |
| United States of America USGB 3.5 01/15/2029 FIX USD Government | 2.61% | 98.35 | 0.09% |
| United States of America USGB 3.875 08/15/2034 FIX USD Government | 2.13% | 96.04 | 0.24% |
Fees & Availability
| Fees | |
| Actual 12B-1 Fee | -- |
| Actual Management Fee | 0.24% |
| Administration Fee | -- |
| Maximum Front Load | -- |
| Maximum Deferred Load | -- |
| Maximum Redemption Fee | -- |
| General Availability | |
| Available for Insurance Product | No |
| Available for RRSP | No |
| Purchase Details | |
| Open to New Investors |
|
| Minimum Initial Investment | 0.00 None |
| Minimum Subsequent Investment | 0.00 None |
Basic Info
| Investment Strategy | |
| The Fund seeks a high level of current income with preservation of capital by investing at least 80% of assets in US government securities, and in instruments related to same. The Fund is managed to have the similar overall interest rate risk to the Barclays Capital Government Bond Index. |
| General | |
| Security Type | Mutual Fund |
| Equity Style | -- |
| Broad Asset Class | Taxable Bond |
| Broad Category | Fixed Income |
| Global Peer Group | Bond USD Government |
| Peer Group | General U.S. Government Funds |
| Global Macro | Bond Government |
| US Macro | U.S. Government & Treasury Fixed Income Funds |
| YCharts Categorization | -- |
| YCharts Benchmark | -- |
| Prospectus Objective | General U.S. Government Funds |
| Fund Owner Firm Name | Fidelity Investments |
| Broad Asset Class Benchmark Index | |
| ^BBUSATR | 100.0% |
Fundamentals
| General | |
| Distribution Yield | -- |
| Dividend Yield TTM (6-8-26) | 3.59% |
| 30-Day SEC Yield (5-31-26) | 4.09% |
| 7-Day SEC Yield | -- |
| Number of Holdings | 1748 |
| Bond | |
| Yield to Maturity (4-30-26) | 4.39% |
| Effective Duration | 5.69 |
| Average Coupon | 3.61% |
| Calculated Average Quality | 1.785 |
| Effective Maturity | 13.58 |
| Nominal Maturity | 13.58 |
| Number of Bond Holdings | 1720 |
As of April 30, 2026
Fund Details
Top Portfolio Holders
| Name | % Weight |
|---|---|
| Portfolio A | 5.00% |
| Portfolio B | 3.50% |
| Portfolio C | 2.25% |
Excel Add-In Codes
| Name: =YCI("M:FIKPX", "name") |
| Broad Asset Class: =YCI("M:FIKPX", "broad_asset_class") |
| Broad Category: =YCI("M:FIKPX", "broad_category_group") |
| Prospectus Objective: =YCI("M:FIKPX", "prospectus_objective") |
| To find the codes for any of our securities and financial metrics, see our Complete Excel Reference. |