

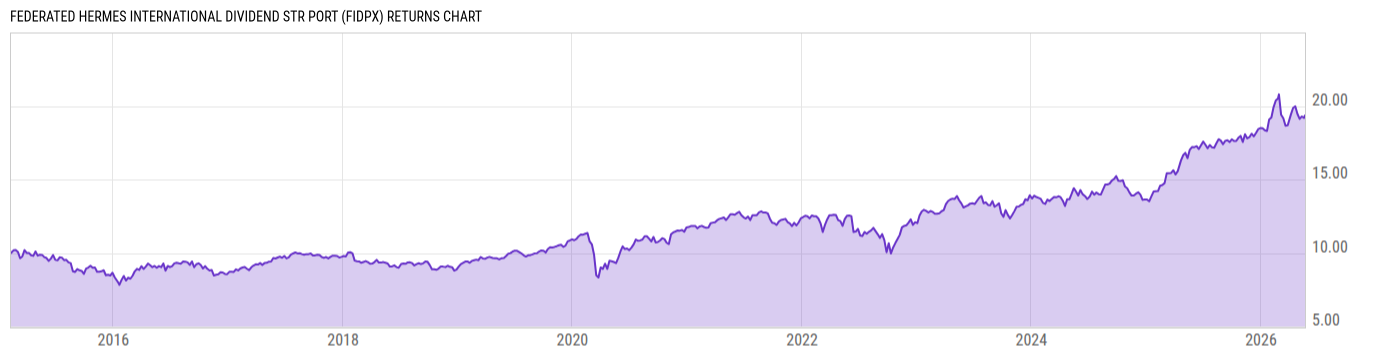
Federated Hermes International Dividend Str Port (FIDPX)
11.19
+0.14
(+1.27%)
USD |
Jun 09 2026
Returns Chart
Key Stats
| Net Expense Ratio | Total Assets Under Management | Weighted Average Dividend Yield | Turnover Ratio (Generic) |
|---|---|---|---|
| 0.00% | 135.47M | 3.97% | 37.00% |
| 1 Year Fund Level Flows | 1 Year Total Returns (Daily) | Annualized Total Returns Since Inception (Daily) | Max Drawdown (Since Inception) |
| 17.83M | 9.98% |
Basic Info
| Investment Strategy | |
| The Fund seeks income and long-term capital appreciation. The Fund invests in equity securities of companies outside the United States, consisting of high dividend-yielding stocks with dividend growth potential. It believes a strategic emphasis on high dividend-yielding stocks can enhance performance over time. |
| General | |
| Security Type | Mutual Fund |
| Equity Style | Multi Cap Value |
| Broad Asset Class | International Equity |
| Broad Category | Equity |
| Global Peer Group | Equity Global Income |
| Peer Group | International Equity Income Funds |
| Global Macro | Equity Global |
| US Macro | Developed International Markets Funds |
| YCharts Categorization | -- |
| YCharts Benchmark | -- |
| Prospectus Objective | International Funds |
| Fund Owner Firm Name | Federated Hermes |
| Broad Asset Class Benchmark Index | |
| ^MSACXUSNTR | 100.0% |
Net Fund Flows Versus Peer Group
1 Month
% Rank:
19
-122.66M
Peer Group Low
201.51M
Peer Group High
1 Year
% Rank:
53
17.83M
-705.67M
Peer Group Low
5.930B
Peer Group High
3 Months
% Rank:
32
-218.22M
Peer Group Low
549.16M
Peer Group High
3 Years
% Rank:
63
-1.863B
Peer Group Low
8.513B
Peer Group High
6 Months
% Rank:
34
-493.35M
Peer Group Low
3.622B
Peer Group High
5 Years
% Rank:
60
-3.770B
Peer Group Low
12.15B
Peer Group High
YTD
% Rank:
42
-507.71M
Peer Group Low
2.979B
Peer Group High
10 Years
% Rank:
62
-5.323B
Peer Group Low
14.75B
Peer Group High
Date Unavailable
Risk
Performance Versus Peer Group
Annual Total Returns Versus Peers
As of June 10, 2026.
Asset Allocation
As of March 31, 2026.
| Type | % Net |
|---|---|
| Cash | 1.53% |
| Stock | 98.47% |
| Bond | 0.00% |
| Convertible | 0.00% |
| Preferred | 0.00% |
| Other | 0.00% |
Top 10 Holdings
| Name | % Weight | Price | % Change |
|---|---|---|---|
| Münchener Rückversicherungs-Gesellschaft AG | 7.03% | 521.32 | 1.96% |
| Kimberly-Clark de México SAB de CV | 6.83% | 2.18 | 0.00% |
| Allianz SE | 6.36% | 437.31 | 0.84% |
| Royal KPN NV | 6.25% | 5.01 | -0.60% |
| Deutsche Telekom AG | 6.07% | 32.04 | -2.91% |
| UPM-Kymmene Oyj | 4.97% | 29.33 | 0.00% |
| Enel SpA | 4.97% | 11.00 | -5.17% |
| SNAM SpA | 4.77% | 7.532 | 0.00% |
| Compagnie Générale des Établissements Michelin SCA | 4.67% | 37.98 | 0.00% |
| Elisa Oyj | 4.45% | 48.44 | 0.00% |
Fees & Availability
| Fees | |
| Actual 12B-1 Fee | -- |
| Actual Management Fee | -- |
| Administration Fee | 77.98K% |
| Maximum Front Load | -- |
| Maximum Deferred Load | -- |
| Maximum Redemption Fee | -- |
| General Availability | |
| Available for Insurance Product | No |
| Available for RRSP | No |
| Purchase Details | |
| Open to New Investors |
|
| Minimum Initial Investment | 0.00 None |
| Minimum Subsequent Investment | 0.00 None |
Basic Info
| Investment Strategy | |
| The Fund seeks income and long-term capital appreciation. The Fund invests in equity securities of companies outside the United States, consisting of high dividend-yielding stocks with dividend growth potential. It believes a strategic emphasis on high dividend-yielding stocks can enhance performance over time. |
| General | |
| Security Type | Mutual Fund |
| Equity Style | Multi Cap Value |
| Broad Asset Class | International Equity |
| Broad Category | Equity |
| Global Peer Group | Equity Global Income |
| Peer Group | International Equity Income Funds |
| Global Macro | Equity Global |
| US Macro | Developed International Markets Funds |
| YCharts Categorization | -- |
| YCharts Benchmark | -- |
| Prospectus Objective | International Funds |
| Fund Owner Firm Name | Federated Hermes |
| Broad Asset Class Benchmark Index | |
| ^MSACXUSNTR | 100.0% |
Fundamentals
| General | |
| Distribution Yield | -- |
| Dividend Yield TTM (6-8-26) | 4.64% |
| 30-Day SEC Yield (5-31-26) | 4.36% |
| 7-Day SEC Yield | -- |
| Number of Holdings | 26 |
| Stock | |
| Weighted Average PE Ratio | 17.30 |
| Weighted Average Price to Sales Ratio | 2.704 |
| Weighted Average Price to Book Ratio | 3.953 |
| Weighted Median ROE | 22.66% |
| Weighted Median ROA | 5.21% |
| ROI (TTM) | 10.57% |
| Return on Investment (TTM) | 10.57% |
| Earning Yield | 0.0619 |
| LT Debt / Shareholders Equity | 1.260 |
| Number of Equity Holdings | 25 |
As of March 31, 2026
Growth Metrics
| EPS Growth (1Y) | 8.25% |
| EPS Growth (3Y) | 3.39% |
| EPS Growth (5Y) | 8.12% |
| Sales Growth (1Y) | 3.60% |
| Sales Growth (3Y) | 1.18% |
| Sales Growth (5Y) | 4.24% |
| Sales per Share Growth (1Y) | 3.89% |
| Sales per Share Growth (3Y) | 2.02% |
| Operating Cash Flow - Growth Rate (3Y) | 8.86% |
As of March 31, 2026
Fund Details
| Key Dates | |
| Inception Date | 2/9/2015 |
| Last Annual Report Date | 10/31/2025 |
| Last Prospectus Date | 12/31/2025 |
| Attributes | |
| Index Fund | -- |
| Inverse Fund | No |
| Leveraged Fund | -- |
| Fund of Funds | No |
| Currency Hedged Fund | -- |
| Socially Responsible Fund | No |
Top Portfolio Holders
| Name | % Weight |
|---|---|
| Portfolio A | 5.00% |
| Portfolio B | 3.50% |
| Portfolio C | 2.25% |
Excel Add-In Codes
| Name: =YCI("M:FIDPX", "name") |
| Broad Asset Class: =YCI("M:FIDPX", "broad_asset_class") |
| Broad Category: =YCI("M:FIDPX", "broad_category_group") |
| Prospectus Objective: =YCI("M:FIDPX", "prospectus_objective") |
| To find the codes for any of our securities and financial metrics, see our Complete Excel Reference. |