

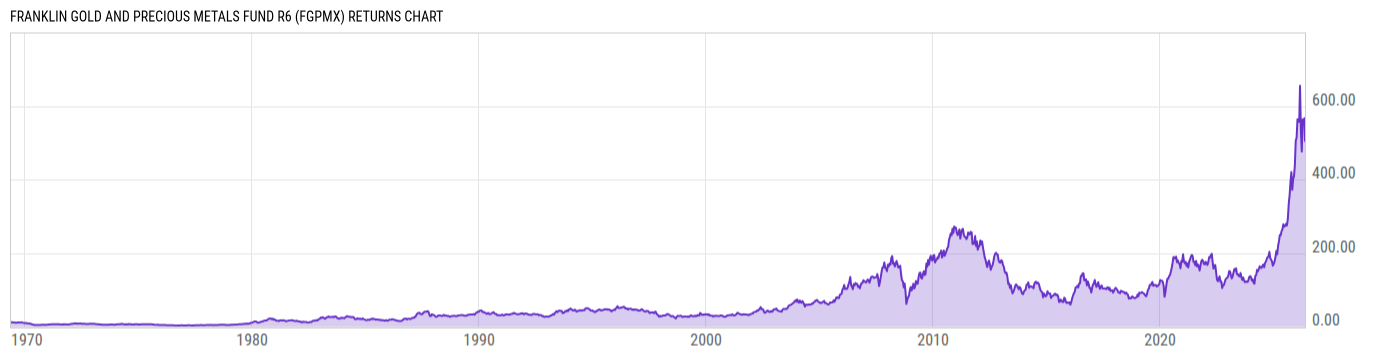
Franklin Gold and Precious Metals Fund R6 (FGPMX)
45.80
-2.55
(-5.27%)
USD |
Jun 10 2026
Returns Chart
Key Stats
| Net Expense Ratio | Total Assets Under Management | Weighted Average Dividend Yield | Turnover Ratio (Generic) |
|---|---|---|---|
| 0.54% | 3.483B | 0.57% | 23.00% |
| 1 Year Fund Level Flows | 1 Year Total Returns (Daily) | Annualized Total Returns Since Inception (Daily) | Max Drawdown (Since Inception) |
| 504.34M | 54.78% |
Basic Info
| Investment Strategy | |
| The Fund seeks capital appreciation, and a secondary goal to provide current income through dividends or interest received from its investments. The Fund invests at least 80% of its net assets in securities of gold and precious metals operation companies that mine, process, or deal in gold and other precious metals. |
| General | |
| Security Type | Mutual Fund |
| Equity Style | Mid Cap Growth |
| Broad Asset Class | Sector Equity |
| Broad Category | Equity |
| Global Peer Group | Equity Sector Gold & Precious Metals |
| Peer Group | Precious Metals Equity Funds |
| Global Macro | Equity Industry Sector |
| US Macro | World Sector Equity Funds |
| YCharts Categorization | -- |
| YCharts Benchmark | -- |
| Prospectus Objective | Precious Metals Equity Funds |
| Fund Owner Firm Name | Franklin Templeton |
| Broad Asset Class Benchmark Index | |
| ^MSWNTR | 100.0% |
Net Fund Flows Versus Peer Group
1 Month
% Rank:
60
-367.61M
Peer Group Low
21.98M
Peer Group High
1 Year
% Rank:
8
504.34M
-1.328B
Peer Group Low
1.112B
Peer Group High
3 Months
% Rank:
17
-993.82M
Peer Group Low
76.15M
Peer Group High
3 Years
% Rank:
12
-4.364B
Peer Group Low
1.215B
Peer Group High
6 Months
% Rank:
5
-1.495B
Peer Group Low
907.07M
Peer Group High
5 Years
% Rank:
20
-4.788B
Peer Group Low
1.251B
Peer Group High
YTD
% Rank:
7
-1.141B
Peer Group Low
573.51M
Peer Group High
10 Years
% Rank:
17
-2.619B
Peer Group Low
2.192B
Peer Group High
Date Unavailable
Risk
Performance Versus Peer Group
Annual Total Returns Versus Peers
As of June 11, 2026.
Asset Allocation
As of March 31, 2026.
| Type | % Net |
|---|---|
| Cash | 0.05% |
| Stock | 98.91% |
| Bond | 0.00% |
| Convertible | 0.00% |
| Preferred | 0.00% |
| Other | 1.03% |
Top 10 Holdings
| Name | % Weight | Price | % Change |
|---|---|---|---|
| Alamos Gold, Inc. | 5.56% | 34.48 | 4.45% |
| Barrick Mining Corp. | 4.96% | 54.55 | 5.27% |
|
G Mining Ventures Corp 144A
|
4.25% | -- | -- |
| Equinox Gold Corp. | 3.94% | 10.27 | 5.55% |
| Anglogold Ashanti Plc | 2.96% | 83.22 | 6.05% |
| Newmont Corp. | 2.78% | 112.00 | 0.00% |
| Agnico Eagle Mines Ltd. | 2.59% | 157.76 | 3.46% |
| Newmont Corp. | 2.49% | 97.58 | 5.18% |
| Perseus Mining Ltd. | 2.05% | 3.225 | -1.07% |
| Endeavour Mining Plc | 2.00% | 69.78 | 4.76% |
Fees & Availability
| Fees | |
| Actual 12B-1 Fee | -- |
| Actual Management Fee | 0.45% |
| Administration Fee | -- |
| Maximum Front Load | -- |
| Maximum Deferred Load | -- |
| Maximum Redemption Fee | -- |
| General Availability | |
| Available for Insurance Product | No |
| Available for RRSP | No |
| Purchase Details | |
| Open to New Investors |
|
| Minimum Initial Investment | 1.00M None |
| Minimum Subsequent Investment | 0.00 None |
Basic Info
| Investment Strategy | |
| The Fund seeks capital appreciation, and a secondary goal to provide current income through dividends or interest received from its investments. The Fund invests at least 80% of its net assets in securities of gold and precious metals operation companies that mine, process, or deal in gold and other precious metals. |
| General | |
| Security Type | Mutual Fund |
| Equity Style | Mid Cap Growth |
| Broad Asset Class | Sector Equity |
| Broad Category | Equity |
| Global Peer Group | Equity Sector Gold & Precious Metals |
| Peer Group | Precious Metals Equity Funds |
| Global Macro | Equity Industry Sector |
| US Macro | World Sector Equity Funds |
| YCharts Categorization | -- |
| YCharts Benchmark | -- |
| Prospectus Objective | Precious Metals Equity Funds |
| Fund Owner Firm Name | Franklin Templeton |
| Broad Asset Class Benchmark Index | |
| ^MSWNTR | 100.0% |
Fundamentals
| General | |
| Distribution Yield | -- |
| Dividend Yield TTM (6-10-26) | 11.01% |
| 30-Day SEC Yield | -- |
| 7-Day SEC Yield | -- |
| Number of Holdings | 260 |
| Stock | |
| Weighted Average PE Ratio | 19.60 |
| Weighted Average Price to Sales Ratio | 8.418 |
| Weighted Average Price to Book Ratio | 4.850 |
| Weighted Median ROE | 5.86% |
| Weighted Median ROA | 6.19% |
| ROI (TTM) | 6.55% |
| Return on Investment (TTM) | 6.55% |
| Earning Yield | 0.0608 |
| LT Debt / Shareholders Equity | 0.1247 |
| Number of Equity Holdings | 255 |
As of March 31, 2026
Growth Metrics
| EPS Growth (1Y) | 56.15% |
| EPS Growth (3Y) | 55.44% |
| EPS Growth (5Y) | 26.38% |
| Sales Growth (1Y) | 51.83% |
| Sales Growth (3Y) | 32.37% |
| Sales Growth (5Y) | 26.46% |
| Sales per Share Growth (1Y) | 589.6% |
| Sales per Share Growth (3Y) | 59.86% |
| Operating Cash Flow - Growth Rate (3Y) | 64.71% |
As of March 31, 2026
Fund Details
Top Portfolio Holders
| Name | % Weight |
|---|---|
| Portfolio A | 5.00% |
| Portfolio B | 3.50% |
| Portfolio C | 2.25% |
Excel Add-In Codes
| Name: =YCI("M:FGPMX", "name") |
| Broad Asset Class: =YCI("M:FGPMX", "broad_asset_class") |
| Broad Category: =YCI("M:FGPMX", "broad_category_group") |
| Prospectus Objective: =YCI("M:FGPMX", "prospectus_objective") |
| To find the codes for any of our securities and financial metrics, see our Complete Excel Reference. |