

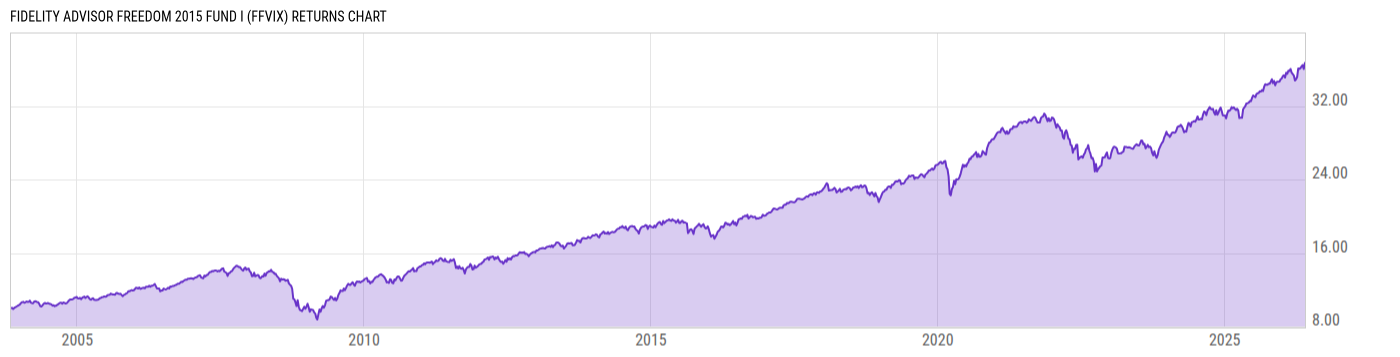
Fidelity Advisor Freedom 2015 Fund I (FFVIX)
11.48
+0.01
(+0.09%)
USD |
May 27 2026
Returns Chart
Key Stats
| Net Expense Ratio | Total Assets Under Management | Weighted Average Dividend Yield | Turnover Ratio (Generic) |
|---|---|---|---|
| 0.50% | 419.66M | -- | 17.00% |
| 1 Year Fund Level Flows | 1 Year Total Returns (Daily) | Annualized Total Returns Since Inception (Daily) | Max Drawdown (Since Inception) |
| -62.27M | 13.56% |
Basic Info
| Investment Strategy | |
| The Fund seeks high total return with a secondary objective of principal preservation as the fund approaches its target date and beyond. The fund currently invests in 60% equity and 40% fixed income but will approach an allocation of 20% equity and 80% fixed income in 2015. |
| General | |
| Security Type | Mutual Fund |
| Equity Style | -- |
| Broad Asset Class | Allocation |
| Broad Category | Allocation |
| Global Peer Group | Target Maturity MA USD 2015 |
| Peer Group | Mixed-Asset Target 2015 Funds |
| Global Macro | Target Maturity |
| US Macro | Mixed-Assets Target Date Funds |
| YCharts Categorization | -- |
| YCharts Benchmark | -- |
| Prospectus Objective | Income Funds |
| Fund Owner Firm Name | Fidelity Investments |
| Broad Asset Class Benchmark Index | |
| ^SPXTR | 100.0% |
Net Fund Flows Versus Peer Group
1 Month
% Rank:
49
-71.03M
Peer Group Low
2.973M
Peer Group High
1 Year
% Rank:
63
-62.27M
-793.22M
Peer Group Low
99.60M
Peer Group High
3 Months
% Rank:
58
-181.48M
Peer Group Low
17.69M
Peer Group High
3 Years
% Rank:
63
-2.628B
Peer Group Low
233.62M
Peer Group High
6 Months
% Rank:
50
-410.58M
Peer Group Low
39.87M
Peer Group High
5 Years
% Rank:
67
-4.819B
Peer Group Low
315.08M
Peer Group High
YTD
% Rank:
50
-253.29M
Peer Group Low
29.92M
Peer Group High
10 Years
% Rank:
72
-10.38B
Peer Group Low
403.09M
Peer Group High
Date Unavailable
Risk
Performance Versus Peer Group
Annual Total Returns Versus Peers
As of May 28, 2026.
Asset Allocation
As of March 31, 2026.
| Type | % Net |
|---|---|
| Cash | 8.53% |
| Stock | 36.92% |
| Bond | 58.56% |
| Convertible | 0.00% |
| Preferred | 0.26% |
| Other | -4.27% |
Top 10 Holdings
| Name | % Weight | Price | % Change |
|---|---|---|---|
| Fidelity Series Investment Grade Bond Fund | 30.54% | 10.05 | 0.10% |
| Fidelity Series 0-5 Year Inflation-Protected Bd Id | 12.10% | 10.02 | 0.10% |
| Fidelity Series Emerging Markets Opportunities Fnd | 4.78% | 31.75 | 0.35% |
| Fidelity Series International Developed Mkts Bd Id | 4.66% | 8.46 | 0.00% |
| Fidelity Series Large Cap Stock Fund | 4.09% | 29.26 | 0.00% |
| Fidelity Series 5+ Year Inflation-Protected Bd Idx | 4.04% | 7.66 | 0.13% |
|
10YR UL TN JUN26
|
3.93% | -- | -- |
| Fidelity Series Government Money Market Fund | 3.89% | 1.00 | 0.00% |
| Fidelity Series International Value Fund | 3.11% | 16.83 | -0.41% |
| Fidelity Series Overseas Fund | 3.05% | 15.71 | -0.38% |
Fees & Availability
| Fees | |
| Actual 12B-1 Fee | -- |
| Actual Management Fee | 0.50% |
| Administration Fee | -- |
| Maximum Front Load | -- |
| Maximum Deferred Load | -- |
| Maximum Redemption Fee | -- |
| General Availability | |
| Available for Insurance Product | No |
| Available for RRSP | No |
| Purchase Details | |
| Open to New Investors |
|
| Minimum Initial Investment | 0.00 None |
| Minimum Subsequent Investment | 0.00 None |
Basic Info
| Investment Strategy | |
| The Fund seeks high total return with a secondary objective of principal preservation as the fund approaches its target date and beyond. The fund currently invests in 60% equity and 40% fixed income but will approach an allocation of 20% equity and 80% fixed income in 2015. |
| General | |
| Security Type | Mutual Fund |
| Equity Style | -- |
| Broad Asset Class | Allocation |
| Broad Category | Allocation |
| Global Peer Group | Target Maturity MA USD 2015 |
| Peer Group | Mixed-Asset Target 2015 Funds |
| Global Macro | Target Maturity |
| US Macro | Mixed-Assets Target Date Funds |
| YCharts Categorization | -- |
| YCharts Benchmark | -- |
| Prospectus Objective | Income Funds |
| Fund Owner Firm Name | Fidelity Investments |
| Broad Asset Class Benchmark Index | |
| ^SPXTR | 100.0% |
Fundamentals
| General | |
| Distribution Yield | -- |
| Dividend Yield TTM (5-26-26) | 2.78% |
| 30-Day SEC Yield (10-3-23) | 0.00% |
| 7-Day SEC Yield (10-3-23) | 0.00% |
| Number of Holdings | 46 |
| Stock | |
| Weighted Average PE Ratio | 27.89 |
| Weighted Average Price to Sales Ratio | 6.382 |
| Weighted Average Price to Book Ratio | 7.455 |
| Weighted Median ROE | 42.34% |
| Weighted Median ROA | 12.40% |
| ROI (TTM) | 18.40% |
| Return on Investment (TTM) | 18.40% |
| Earning Yield | 0.0486 |
| LT Debt / Shareholders Equity | 0.6748 |
| Number of Equity Holdings | 0 |
| Bond | |
| Yield to Maturity (3-31-26) | 3.27% |
| Effective Duration | -- |
| Average Coupon | 3.14% |
| Calculated Average Quality | 2.235 |
| Effective Maturity | 10.06 |
| Nominal Maturity | 10.12 |
| Number of Bond Holdings | 4 |
As of March 31, 2026
Growth Metrics
| EPS Growth (1Y) | 28.04% |
| EPS Growth (3Y) | 18.85% |
| EPS Growth (5Y) | 24.30% |
| Sales Growth (1Y) | 14.52% |
| Sales Growth (3Y) | 12.79% |
| Sales Growth (5Y) | 14.41% |
| Sales per Share Growth (1Y) | 29.23% |
| Sales per Share Growth (3Y) | 13.51% |
| Operating Cash Flow - Growth Rate (3Y) | 21.71% |
As of March 31, 2026
Fund Details
Top Portfolio Holders
| Name | % Weight |
|---|---|
| Portfolio A | 5.00% |
| Portfolio B | 3.50% |
| Portfolio C | 2.25% |
Excel Add-In Codes
| Name: =YCI("M:FFVIX", "name") |
| Broad Asset Class: =YCI("M:FFVIX", "broad_asset_class") |
| Broad Category: =YCI("M:FFVIX", "broad_category_group") |
| Prospectus Objective: =YCI("M:FFVIX", "prospectus_objective") |
| To find the codes for any of our securities and financial metrics, see our Complete Excel Reference. |