

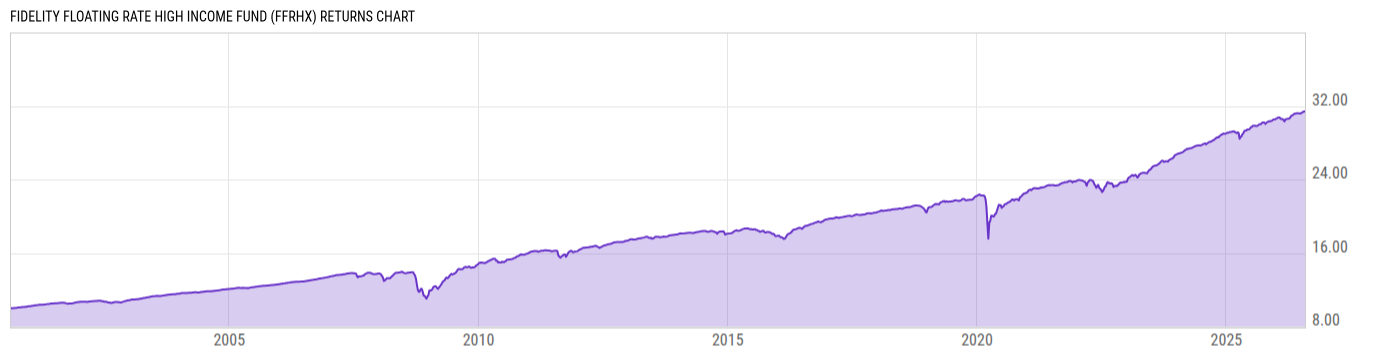
Fidelity Floating Rate High Income Fund (FFRHX)
9.00
0.00 (0.00%)
USD |
Jul 31 2026
Returns Chart
Key Stats
| Net Expense Ratio | Total Assets Under Management | Weighted Average Dividend Yield | Turnover Ratio (Generic) |
|---|---|---|---|
| 0.73% | 14.44B | -- | 58.00% |
| 1 Year Fund Level Flows | 1 Year Total Returns (Daily) | Annualized Total Returns Since Inception (Daily) | Max Drawdown (Since Inception) |
| -1.150B | 5.27% |
Basic Info
| Investment Strategy | |
| The Fund seeks high current income. Invests mainly in income-producing floating rate loans and other floating-rate debt securities. Floating rate loans are often lower-quality debt securities and are generally subject to restrictions on resale. |
| General | |
| Security Type | Mutual Fund |
| Equity Style | -- |
| Broad Asset Class | Taxable Bond |
| Broad Category | Fixed Income |
| Global Peer Group | Loan Participation Funds |
| Peer Group | Loan Participation Funds |
| Global Macro | Loan Participation Funds |
| US Macro | General Domestic Taxable Fixed Income Funds |
| YCharts Categorization | -- |
| YCharts Benchmark | -- |
| Prospectus Objective | Loan Participation Funds |
| Fund Owner Firm Name | Fidelity Investments |
| Broad Asset Class Benchmark Index | |
| ^BBUSATR | 100.0% |
Net Fund Flows Versus Peer Group
1 Month
% Rank:
5
-472.08M
Peer Group Low
1.022B
Peer Group High
1 Year
% Rank:
93
-1.150B
-1.892B
Peer Group Low
6.831B
Peer Group High
3 Months
% Rank:
6
-291.95M
Peer Group Low
2.129B
Peer Group High
3 Years
% Rank:
8
-2.572B
Peer Group Low
23.11B
Peer Group High
6 Months
% Rank:
93
-1.169B
Peer Group Low
3.761B
Peer Group High
5 Years
% Rank:
3
-4.590B
Peer Group Low
26.18B
Peer Group High
YTD
% Rank:
93
-1.282B
Peer Group Low
4.794B
Peer Group High
10 Years
% Rank:
10
-10.64B
Peer Group Low
3.045B
Peer Group High
Date Unavailable
Risk
Performance Versus Peer Group
Annual Total Returns Versus Peers
As of August 02, 2026.
Asset Allocation
As of April 30, 2026.
| Type | % Net |
|---|---|
| Cash | 1.30% |
| Stock | 1.89% |
| Bond | 97.23% |
| Convertible | 0.00% |
| Preferred | 0.33% |
| Other | -0.74% |
Top 10 Holdings
| Name | % Weight | Price | % Change |
|---|---|---|---|
|
Fidelity Cash Central Fund
|
6.80% | -- | -- |
|
American Sportsman Holdings Co 21-JAN-2032 Term Loan B
|
2.58% | -- | -- |
|
Golden Nugget FRN 29-Jan-2029
|
1.20% | -- | -- |
|
Acrisure LLC 06-NOV-2030 Term Loan B
|
1.09% | -- | -- |
|
Solera Holdings Inc 04-JUN-2028 Term Loan B
|
0.96% | -- | -- |
|
Fidelity Private Credit Fund
|
0.92% | -- | -- |
|
UKG Inc [Ex- Ultimate Software Inc] 09-FEB-2031 Term Loan B
|
0.83% | -- | -- |
|
Asurion LLC 23-FEB-2033 Term Loan B
|
0.83% | -- | -- |
|
Nielsen NV 03-FEB-2033 Term Loan B
|
0.81% | -- | -- |
|
Discovery Global Holdings Inc [Ex - WarnerMedia Holdings Inc] 27-MAY-2033 Term Loan B
|
0.79% | -- | -- |
Fees & Availability
| Fees | |
| Actual 12B-1 Fee | -- |
| Actual Management Fee | 0.64% |
| Administration Fee | -- |
| Maximum Front Load | -- |
| Maximum Deferred Load | -- |
| Maximum Redemption Fee | 0.00% |
| General Availability | |
| Available for Insurance Product | No |
| Available for RRSP | No |
| Purchase Details | |
| Open to New Investors |
|
| Minimum Initial Investment | 0.00 None |
| Minimum Subsequent Investment | 0.00 None |
Projected Income
| Type | Aug | Sep | Oct | Nov | Dec | Jan | Feb | Mar | Apr | May | Jun | Jul |
|---|---|---|---|---|---|---|---|---|---|---|---|---|
|
Qualified Income
|
-- | -- | -- | -- | -- | -- | -- | -- | -- | -- | -- | -- |
|
Normal
|
-- | -- | -- | -- | -- | -- | -- | -- | -- | -- | -- | -- |
|
Qualified
|
-- | -- | -- | -- | -- | -- | -- | -- | -- | -- | -- | -- |
|
LT Cap Gains
|
-- | -- | -- | -- | -- | -- | -- | -- | -- | -- | -- | -- |
|
Ordinary Income
|
-- | -- | -- | -- | -- | -- | -- | -- | -- | -- | -- | -- |
|
Non-Qual
|
-- | -- | -- | -- | -- | -- | -- | -- | -- | -- | -- | -- |
|
ST Cap Gains
|
-- | -- | -- | -- | -- | -- | -- | -- | -- | -- | -- | -- |
|
Interest
|
-- | -- | -- | -- | -- | -- | -- | -- | -- | -- | -- | -- |
|
Tax-Exempt
|
-- | -- | -- | -- | -- | -- | -- | -- | -- | -- | -- | -- |
|
ROC
|
-- | -- | -- | -- | -- | -- | -- | -- | -- | -- | -- | -- |
|
Other
|
-- | -- | -- | -- | -- | -- | -- | -- | -- | -- | -- | -- |
|
Total
|
-- | -- | -- | -- | -- | -- | -- | -- | -- | -- | -- | -- |
As of July 31, 2026.
Basic Info
| Investment Strategy | |
| The Fund seeks high current income. Invests mainly in income-producing floating rate loans and other floating-rate debt securities. Floating rate loans are often lower-quality debt securities and are generally subject to restrictions on resale. |
| General | |
| Security Type | Mutual Fund |
| Equity Style | -- |
| Broad Asset Class | Taxable Bond |
| Broad Category | Fixed Income |
| Global Peer Group | Loan Participation Funds |
| Peer Group | Loan Participation Funds |
| Global Macro | Loan Participation Funds |
| US Macro | General Domestic Taxable Fixed Income Funds |
| YCharts Categorization | -- |
| YCharts Benchmark | -- |
| Prospectus Objective | Loan Participation Funds |
| Fund Owner Firm Name | Fidelity Investments |
| Broad Asset Class Benchmark Index | |
| ^BBUSATR | 100.0% |
Fundamentals
| General | |
| Distribution Yield | -- |
| Dividend Yield TTM (7-31-26) | 6.97% |
| 30-Day SEC Yield (6-30-26) | 6.98% |
| 7-Day SEC Yield | -- |
| Number of Holdings | 565 |
| Bond | |
| Yield to Maturity (4-30-26) | 7.42% |
| Effective Duration | -- |
| Average Coupon | 8.16% |
| Calculated Average Quality | 5.700 |
| Effective Maturity | 4.748 |
| Nominal Maturity | 4.982 |
| Number of Bond Holdings | 539 |
As of April 30, 2026
Fund Details
Top Portfolio Holders
| Name | % Weight |
|---|---|
| Portfolio A | 5.00% |
| Portfolio B | 3.50% |
| Portfolio C | 2.25% |
Excel Add-In Codes
| Name: =YCI("M:FFRHX", "name") |
| Broad Asset Class: =YCI("M:FFRHX", "broad_asset_class") |
| Broad Category: =YCI("M:FFRHX", "broad_category_group") |
| Prospectus Objective: =YCI("M:FFRHX", "prospectus_objective") |
| To find the codes for any of our securities and financial metrics, see our Complete Excel Reference. |