

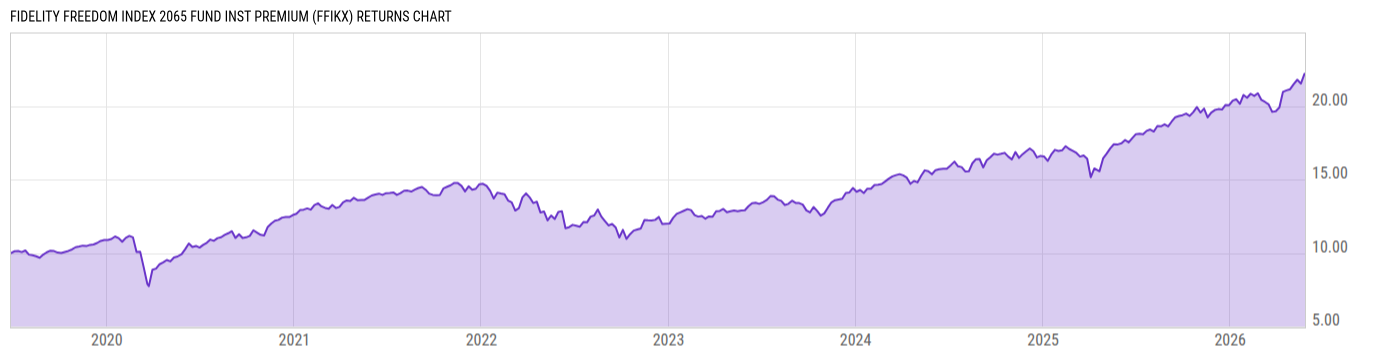
Fidelity Freedom Index 2065 Fund Inst Premium (FFIKX)
19.39
-0.01
(-0.05%)
USD |
May 27 2026
Returns Chart
Key Stats
| Net Expense Ratio | Total Assets Under Management | Weighted Average Dividend Yield | Turnover Ratio (Generic) |
|---|---|---|---|
| 0.08% | 5.242B | -- | 9.00% |
| 1 Year Fund Level Flows | 1 Year Total Returns (Daily) | Annualized Total Returns Since Inception (Daily) | Max Drawdown (Since Inception) |
| 1.346B | 27.53% |
Basic Info
| Investment Strategy | |
| The Fund seeks high total return until its target retirement date. Thereafter the fund's objective will be to seek high current income and, as a secondary objective, capital appreciation. It invests primarily in a combination of Fidelity domestic equity funds, international equity funds, bond funds, and short-term funds. |
| General | |
| Security Type | Mutual Fund |
| Equity Style | -- |
| Broad Asset Class | Allocation |
| Broad Category | Allocation |
| Global Peer Group | Target Maturity MA USD 2060+ |
| Peer Group | Mixed-Asset Target 2060+ Funds |
| Global Macro | Target Maturity |
| US Macro | Mixed-Assets Target Date Funds |
| YCharts Categorization | -- |
| YCharts Benchmark | -- |
| Prospectus Objective | Growth Funds |
| Fund Owner Firm Name | Fidelity Investments |
| Broad Asset Class Benchmark Index | |
| ^SPXTR | 100.0% |
Net Fund Flows Versus Peer Group
1 Month
% Rank:
2
-14.34M
Peer Group Low
322.36M
Peer Group High
1 Year
% Rank:
2
1.346B
-5.991M
Peer Group Low
2.735B
Peer Group High
3 Months
% Rank:
2
-16.64M
Peer Group Low
946.30M
Peer Group High
3 Years
% Rank:
6
185845.0
Peer Group Low
6.529B
Peer Group High
6 Months
% Rank:
2
-14.16M
Peer Group Low
1.544B
Peer Group High
5 Years
% Rank:
6
185845.0
Peer Group Low
8.198B
Peer Group High
YTD
% Rank:
2
-25.12M
Peer Group Low
946.30M
Peer Group High
10 Years
% Rank:
6
185845.0
Peer Group Low
9.176B
Peer Group High
Date Unavailable
Risk
Performance Versus Peer Group
Annual Total Returns Versus Peers
As of May 28, 2026.
Asset Allocation
As of March 31, 2026.
| Type | % Net |
|---|---|
| Cash | 0.73% |
| Stock | 91.28% |
| Bond | 7.89% |
| Convertible | 0.00% |
| Preferred | 0.30% |
| Other | -0.21% |
Top 6 Holdings
| Name | % Weight | Price | % Change |
|---|---|---|---|
| Fidelity Series Total Market Index Fund | 56.18% | 24.51 | 0.00% |
| Fidelity Series Global ex US Index Fund | 36.04% | 20.85 | -0.14% |
| Fidelity Series Long-Term Treasury Bond Index Fund | 5.12% | 5.26 | 0.19% |
| Fidelity Series Bond Index Fund | 2.10% | 9.01 | 0.00% |
| Fidelity Series International Developed Mkts Bd Id | 0.53% | 8.46 | 0.00% |
|
Other Assets less Liabilities
|
0.02% | -- | -- |
Fees & Availability
| Fees | |
| Actual 12B-1 Fee | -- |
| Actual Management Fee | 0.08% |
| Administration Fee | -- |
| Maximum Front Load | -- |
| Maximum Deferred Load | -- |
| Maximum Redemption Fee | -- |
| General Availability | |
| Available for Insurance Product | No |
| Available for RRSP | No |
| Purchase Details | |
| Open to New Investors |
|
| Minimum Initial Investment | 5.00M None |
| Minimum Subsequent Investment | 0.00 None |
Basic Info
| Investment Strategy | |
| The Fund seeks high total return until its target retirement date. Thereafter the fund's objective will be to seek high current income and, as a secondary objective, capital appreciation. It invests primarily in a combination of Fidelity domestic equity funds, international equity funds, bond funds, and short-term funds. |
| General | |
| Security Type | Mutual Fund |
| Equity Style | -- |
| Broad Asset Class | Allocation |
| Broad Category | Allocation |
| Global Peer Group | Target Maturity MA USD 2060+ |
| Peer Group | Mixed-Asset Target 2060+ Funds |
| Global Macro | Target Maturity |
| US Macro | Mixed-Assets Target Date Funds |
| YCharts Categorization | -- |
| YCharts Benchmark | -- |
| Prospectus Objective | Growth Funds |
| Fund Owner Firm Name | Fidelity Investments |
| Broad Asset Class Benchmark Index | |
| ^SPXTR | 100.0% |
Fundamentals
| General | |
| Distribution Yield | -- |
| Dividend Yield TTM (5-26-26) | 1.69% |
| 30-Day SEC Yield (10-3-23) | 0.00% |
| 7-Day SEC Yield (10-3-23) | 0.00% |
| Number of Holdings | 6 |
| Stock | |
| Weighted Average PE Ratio | 29.64 |
| Weighted Average Price to Sales Ratio | 6.844 |
| Weighted Average Price to Book Ratio | 8.370 |
| Weighted Median ROE | 69.45% |
| Weighted Median ROA | 12.43% |
| ROI (TTM) | 18.74% |
| Return on Investment (TTM) | 18.74% |
| Earning Yield | 0.0478 |
| LT Debt / Shareholders Equity | 0.7630 |
| Number of Equity Holdings | 0 |
| Bond | |
| Yield to Maturity (3-31-26) | 4.59% |
| Effective Duration | -- |
| Average Coupon | 3.42% |
| Calculated Average Quality | 2.090 |
| Effective Maturity | 18.47 |
| Nominal Maturity | 18.48 |
| Number of Bond Holdings | 0 |
As of March 31, 2026
Growth Metrics
| EPS Growth (1Y) | 23.71% |
| EPS Growth (3Y) | 16.92% |
| EPS Growth (5Y) | 21.54% |
| Sales Growth (1Y) | 12.80% |
| Sales Growth (3Y) | 12.32% |
| Sales Growth (5Y) | 13.77% |
| Sales per Share Growth (1Y) | 19.69% |
| Sales per Share Growth (3Y) | 12.88% |
| Operating Cash Flow - Growth Rate (3Y) | 20.73% |
As of March 31, 2026
Top Portfolio Holders
| Name | % Weight |
|---|---|
| Portfolio A | 5.00% |
| Portfolio B | 3.50% |
| Portfolio C | 2.25% |
Excel Add-In Codes
| Name: =YCI("M:FFIKX", "name") |
| Broad Asset Class: =YCI("M:FFIKX", "broad_asset_class") |
| Broad Category: =YCI("M:FFIKX", "broad_category_group") |
| Prospectus Objective: =YCI("M:FFIKX", "prospectus_objective") |
| To find the codes for any of our securities and financial metrics, see our Complete Excel Reference. |