

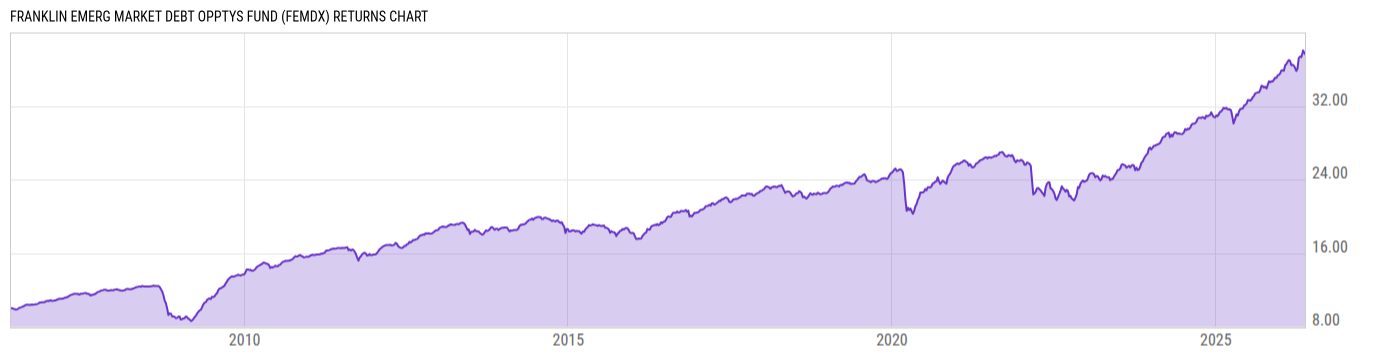
Franklin Emerg Market Debt Opptys Fund (FEMDX)
13.40
-0.03
(-0.22%)
USD |
Jun 08 2026
Returns Chart
Key Stats
| Net Expense Ratio | Total Assets Under Management | Weighted Average Dividend Yield | Turnover Ratio (Generic) |
|---|---|---|---|
| 1.02% | 149.59M | -- | 39.00% |
| 1 Year Fund Level Flows | 1 Year Total Returns (Daily) | Annualized Total Returns Since Inception (Daily) | Max Drawdown (Since Inception) |
| 29.05M | 19.35% |
Basic Info
| Investment Strategy | |
| The Fund seeks high total return. The Fund invests at least 80% of its net assets issued by sovereign and subsovereign government entities, including securities issued by political subdivisions, government agencies, government owned or guaranteed corporations and supranationals located in emerging market countries. |
| General | |
| Security Type | Mutual Fund |
| Equity Style | -- |
| Broad Asset Class | Taxable Bond |
| Broad Category | Fixed Income |
| Global Peer Group | Bond Emerging Markets Global HC |
| Peer Group | Emerging Mrkts Hard Currency Debt Funds |
| Global Macro | Bond Emerging Markets |
| US Macro | Emerging Markets Debt Funds |
| YCharts Categorization | -- |
| YCharts Benchmark | -- |
| Prospectus Objective | Emerging Mrkts Hard Currency Debt Funds |
| Fund Owner Firm Name | Franklin Templeton |
| Broad Asset Class Benchmark Index | |
| ^BBUSATR | 100.0% |
Net Fund Flows Versus Peer Group
1 Month
% Rank:
79
-479.78M
Peer Group Low
234.70M
Peer Group High
1 Year
% Rank:
37
29.05M
-1.381B
Peer Group Low
3.137B
Peer Group High
3 Months
% Rank:
26
-2.227B
Peer Group Low
2.507B
Peer Group High
3 Years
% Rank:
31
-4.106B
Peer Group Low
4.991B
Peer Group High
6 Months
% Rank:
45
-1.796B
Peer Group Low
2.871B
Peer Group High
5 Years
% Rank:
43
-6.046B
Peer Group Low
4.725B
Peer Group High
YTD
% Rank:
67
-2.725B
Peer Group Low
2.885B
Peer Group High
10 Years
% Rank:
80
-6.580B
Peer Group Low
6.009B
Peer Group High
Date Unavailable
Risk
Performance Versus Peer Group
Annual Total Returns Versus Peers
As of June 09, 2026.
Asset Allocation
As of April 30, 2026.
| Type | % Net |
|---|---|
| Cash | -0.60% |
| Stock | 0.02% |
| Bond | 91.98% |
| Convertible | 0.00% |
| Preferred | 0.00% |
| Other | 8.60% |
Top 10 Holdings
| Name | % Weight | Price | % Change |
|---|---|---|---|
| Franklin Institutional US Government Money Mrkt Fd | 5.12% | 1.00 | 0.00% |
|
Iraq, Republic of (Government) 5.8% 15-JAN-2028
|
2.33% | -- | -- |
|
Other Assets less Liabilities
|
2.03% | -- | -- |
| Republic of El Salvador ELSALV 7.65 06/15/2035 FIX USD Sovereign RegS | 2.02% | 102.43 | 0.11% |
|
Brazil, Federative Republic of (Government) 6% 15-MAY-2035
|
1.94% | -- | -- |
| Federal Democratic Republic of Ethiopia FEDEDEM 6.625 12/11/2024 FIX USD Sovereign 144A | 1.89% | 104.81 | 0.06% |
|
Cote d'Ivoire, Republic of (Government) 4.875% 30-JAN-2032
|
1.88% | -- | -- |
|
Turkiye, Republic of (Government) 36% 12-AUG-2026
|
1.80% | -- | -- |
|
United Mexican States (Mexico) (Government) 8% 07-NOV-2047
|
1.78% | -- | -- |
|
Saderea DAC 12.5% 30-NOV-2026
|
1.65% | -- | -- |
Fees & Availability
| Fees | |
| Actual 12B-1 Fee | -- |
| Actual Management Fee | 0.70% |
| Administration Fee | -- |
| Maximum Front Load | -- |
| Maximum Deferred Load | -- |
| Maximum Redemption Fee | 0.00% |
| General Availability | |
| Available for Insurance Product | No |
| Available for RRSP | No |
| Purchase Details | |
| Open to New Investors |
|
| Minimum Initial Investment | 1.00M None |
| Minimum Subsequent Investment | 0.00 None |
Basic Info
| Investment Strategy | |
| The Fund seeks high total return. The Fund invests at least 80% of its net assets issued by sovereign and subsovereign government entities, including securities issued by political subdivisions, government agencies, government owned or guaranteed corporations and supranationals located in emerging market countries. |
| General | |
| Security Type | Mutual Fund |
| Equity Style | -- |
| Broad Asset Class | Taxable Bond |
| Broad Category | Fixed Income |
| Global Peer Group | Bond Emerging Markets Global HC |
| Peer Group | Emerging Mrkts Hard Currency Debt Funds |
| Global Macro | Bond Emerging Markets |
| US Macro | Emerging Markets Debt Funds |
| YCharts Categorization | -- |
| YCharts Benchmark | -- |
| Prospectus Objective | Emerging Mrkts Hard Currency Debt Funds |
| Fund Owner Firm Name | Franklin Templeton |
| Broad Asset Class Benchmark Index | |
| ^BBUSATR | 100.0% |
Fundamentals
| General | |
| Distribution Yield | -- |
| Dividend Yield TTM (6-5-26) | 6.05% |
| 30-Day SEC Yield (4-30-26) | 7.64% |
| 7-Day SEC Yield | -- |
| Number of Holdings | 151 |
| Bond | |
| Yield to Maturity (4-30-26) | 7.56% |
| Effective Duration | 4.27 |
| Average Coupon | 8.73% |
| Calculated Average Quality | 5.495 |
| Effective Maturity | 7.550 |
| Nominal Maturity | 7.740 |
| Number of Bond Holdings | 130 |
As of April 30, 2026
Fund Details
| Key Dates | |
| Inception Date | 5/24/2006 |
| Last Annual Report Date | 7/31/2025 |
| Last Prospectus Date | 12/1/2025 |
| Attributes | |
| Index Fund | -- |
| Inverse Fund | No |
| Leveraged Fund | -- |
| Fund of Funds | No |
| Currency Hedged Fund | -- |
| Socially Responsible Fund | No |
Top Portfolio Holders
| Name | % Weight |
|---|---|
| Portfolio A | 5.00% |
| Portfolio B | 3.50% |
| Portfolio C | 2.25% |
Excel Add-In Codes
| Name: =YCI("M:FEMDX", "name") |
| Broad Asset Class: =YCI("M:FEMDX", "broad_asset_class") |
| Broad Category: =YCI("M:FEMDX", "broad_category_group") |
| Prospectus Objective: =YCI("M:FEMDX", "prospectus_objective") |
| To find the codes for any of our securities and financial metrics, see our Complete Excel Reference. |