

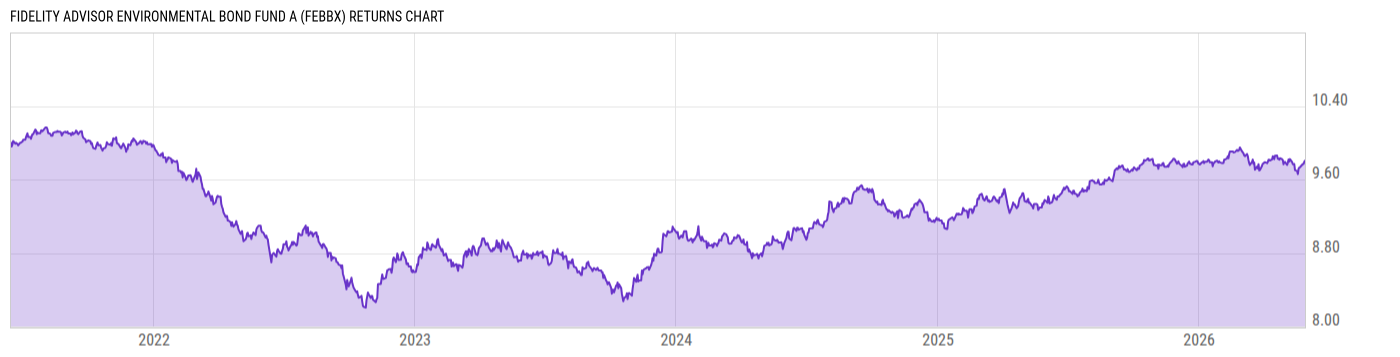
Fidelity Advisor Environmental Bond Fund A (FEBBX)
8.51
+0.01
(+0.12%)
USD |
May 29 2026
Returns Chart
Key Stats
| Net Expense Ratio | Total Assets Under Management | Weighted Average Dividend Yield | Turnover Ratio (Generic) |
|---|---|---|---|
| 0.69% | 38.22M | -- | 50.00% |
| 1 Year Fund Level Flows | 1 Year Total Returns (Daily) | Annualized Total Returns Since Inception (Daily) | Max Drawdown (Since Inception) |
| -6.227M | 4.83% |
Basic Info
| Investment Strategy | |
| The Fund seeks a high level of current income. Under normal market conditions, the Adviser normally invests at least 80% of the fund's assets in environmental debt securities of all types and repurchase agreements for those securities. The Adviser invests the fund's assets primarily in investment-grade debt securities. |
| General | |
| Security Type | Mutual Fund |
| Equity Style | -- |
| Broad Asset Class | Taxable Bond |
| Broad Category | Fixed Income |
| Global Peer Group | Bond USD Medium Term |
| Peer Group | Core Bond Funds |
| Global Macro | Bond HC |
| US Macro | Short/Intermediate Investment-Grade Funds |
| YCharts Categorization | -- |
| YCharts Benchmark | -- |
| Prospectus Objective | Core Bond Funds |
| Fund Owner Firm Name | Fidelity Investments |
| Broad Asset Class Benchmark Index | |
| ^BBUSATR | 100.0% |
Net Fund Flows Versus Peer Group
1 Month
% Rank:
61
-3.494B
Peer Group Low
3.027B
Peer Group High
1 Year
% Rank:
56
-6.227M
-5.277B
Peer Group Low
53.52B
Peer Group High
3 Months
% Rank:
61
-5.205B
Peer Group Low
7.925B
Peer Group High
3 Years
% Rank:
58
-14.12B
Peer Group Low
93.39B
Peer Group High
6 Months
% Rank:
59
-5.281B
Peer Group Low
25.53B
Peer Group High
5 Years
% Rank:
53
-16.57B
Peer Group Low
119.13B
Peer Group High
YTD
% Rank:
60
-5.206B
Peer Group Low
20.55B
Peer Group High
10 Years
% Rank:
62
-15.49B
Peer Group Low
244.84B
Peer Group High
Date Unavailable
Risk
Performance Versus Peer Group
Annual Total Returns Versus Peers
As of May 30, 2026.
Asset Allocation
As of March 31, 2026.
| Type | % Net |
|---|---|
| Cash | 0.58% |
| Stock | 0.00% |
| Bond | 98.51% |
| Convertible | 0.00% |
| Preferred | 0.00% |
| Other | 0.90% |
Top 10 Holdings
| Name | % Weight | Price | % Change |
|---|---|---|---|
|
Other Assets less Liabilities
|
8.00% | -- | -- |
| United States of America USGB 3.75 02/28/2033 FIX USD Government | 4.32% | 96.96 | 0.07% |
| United States of America USGB 4.625 02/15/2055 FIX USD Government | 4.23% | 94.24 | -0.06% |
| United States of America USGB 4.125 02/29/2032 FIX USD Government | 3.44% | 99.60 | 0.07% |
| United States of America USGB 4.625 11/15/2045 FIX USD Government | 3.13% | 95.50 | -0.02% |
| United States of America USGB 3.5 02/28/2031 FIX USD Government | 3.03% | 97.29 | 0.08% |
| United States of America USGB 4.0 11/15/2035 FIX USD Government | 2.96% | 96.70 | 0.06% |
| United States of America USGB 3.875 12/31/2032 FIX USD Government | 2.95% | 97.78 | 0.07% |
| United States of America USGB 4.25 05/15/2035 FIX USD Government | 2.88% | 98.85 | 0.06% |
|
Federal Home Loan Mortgage Corp 01-OCT-2051 RA6275
|
1.99% | -- | -- |
Fees & Availability
| Fees | |
| Actual 12B-1 Fee | 0.25% |
| Actual Management Fee | 0.35% |
| Administration Fee | -- |
| Maximum Front Load | 4.00% |
| Maximum Deferred Load | -- |
| Maximum Redemption Fee | -- |
| General Availability | |
| Available for Insurance Product | No |
| Available for RRSP | No |
| Purchase Details | |
| Open to New Investors |
|
| Minimum Initial Investment | 0.00 None |
| Minimum Subsequent Investment | 0.00 None |
Basic Info
| Investment Strategy | |
| The Fund seeks a high level of current income. Under normal market conditions, the Adviser normally invests at least 80% of the fund's assets in environmental debt securities of all types and repurchase agreements for those securities. The Adviser invests the fund's assets primarily in investment-grade debt securities. |
| General | |
| Security Type | Mutual Fund |
| Equity Style | -- |
| Broad Asset Class | Taxable Bond |
| Broad Category | Fixed Income |
| Global Peer Group | Bond USD Medium Term |
| Peer Group | Core Bond Funds |
| Global Macro | Bond HC |
| US Macro | Short/Intermediate Investment-Grade Funds |
| YCharts Categorization | -- |
| YCharts Benchmark | -- |
| Prospectus Objective | Core Bond Funds |
| Fund Owner Firm Name | Fidelity Investments |
| Broad Asset Class Benchmark Index | |
| ^BBUSATR | 100.0% |
Fundamentals
| General | |
| Distribution Yield | -- |
| Dividend Yield TTM (5-28-26) | 3.56% |
| 30-Day SEC Yield (4-30-26) | 3.68% |
| 7-Day SEC Yield | -- |
| Number of Holdings | 194 |
| Bond | |
| Yield to Maturity (3-31-26) | 4.66% |
| Effective Duration | 6.00 |
| Average Coupon | 4.27% |
| Calculated Average Quality | 2.793 |
| Effective Maturity | 12.32 |
| Nominal Maturity | 12.35 |
| Number of Bond Holdings | 157 |
As of March 31, 2026
Fund Details
Top Portfolio Holders
| Name | % Weight |
|---|---|
| Portfolio A | 5.00% |
| Portfolio B | 3.50% |
| Portfolio C | 2.25% |
Excel Add-In Codes
| Name: =YCI("M:FEBBX", "name") |
| Broad Asset Class: =YCI("M:FEBBX", "broad_asset_class") |
| Broad Category: =YCI("M:FEBBX", "broad_category_group") |
| Prospectus Objective: =YCI("M:FEBBX", "prospectus_objective") |
| To find the codes for any of our securities and financial metrics, see our Complete Excel Reference. |