

Fidelity Massachusetts Municipal Income Fund (FDMMX)
11.48
+0.03
(+0.26%)
USD |
May 27 2026
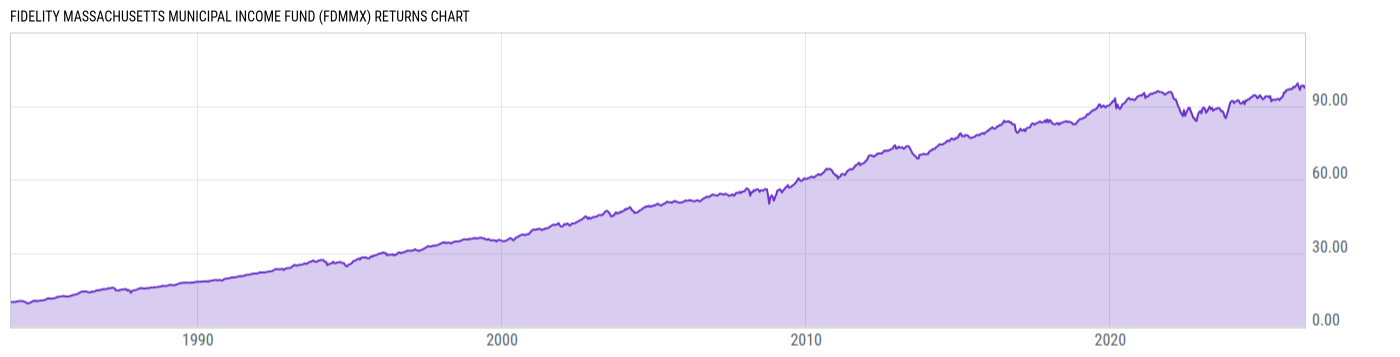
Returns Chart
Key Stats
| Net Expense Ratio | Total Assets Under Management | Weighted Average Dividend Yield | Turnover Ratio (Generic) |
|---|---|---|---|
| 0.44% | 1.619B | -- | 16.00% |
| 1 Year Fund Level Flows | 1 Year Total Returns (Daily) | Annualized Total Returns Since Inception (Daily) | Max Drawdown (Since Inception) |
| -157.83M | 6.20% |
Basic Info
| Investment Strategy | |
| The Fund seeks a high level of current income, exempt from federal income tax and Massachusetts personal income tax. Under normal market and economic conditions, the Fund invests at least 80% of assets in investment-grade municipal securities whose interest is exempt from federal and Massachusetts personal income taxes. |
| General | |
| Security Type | Mutual Fund |
| Equity Style | -- |
| Broad Asset Class | Municipal Bond |
| Broad Category | Fixed Income |
| Global Peer Group | Bond USD Municipal |
| Peer Group | Massachusetts Municipal Debt Funds |
| Global Macro | Bond HC |
| US Macro | Single State Municipal Debt Funds |
| YCharts Categorization | -- |
| YCharts Benchmark | -- |
| Prospectus Objective | Massachusetts Municipal Debt Funds |
| Fund Owner Firm Name | Fidelity Investments |
| Broad Asset Class Benchmark Index | |
| ^BBMBTR | 100.0% |
Net Fund Flows Versus Peer Group
1 Month
% Rank:
87
-5.602M
Peer Group Low
78.75M
Peer Group High
1 Year
% Rank:
100
-157.83M
-157.83M
Peer Group Low
550.40M
Peer Group High
3 Months
% Rank:
100
-171.94M
Peer Group Low
182.44M
Peer Group High
3 Years
% Rank:
100
-425.05M
Peer Group Low
961.73M
Peer Group High
6 Months
% Rank:
100
-135.57M
Peer Group Low
303.59M
Peer Group High
5 Years
% Rank:
100
-690.77M
Peer Group Low
977.20M
Peer Group High
YTD
% Rank:
100
-139.36M
Peer Group Low
182.44M
Peer Group High
10 Years
% Rank:
100
-834.16M
Peer Group Low
1.909B
Peer Group High
Date Unavailable
Risk
Performance Versus Peer Group
Annual Total Returns Versus Peers
As of May 28, 2026.
Asset Allocation
As of March 31, 2026.
| Type | % Net |
|---|---|
| Cash | 1.46% |
| Stock | 0.00% |
| Bond | 98.50% |
| Convertible | 0.00% |
| Preferred | 0.00% |
| Other | 0.04% |
Top 10 Holdings
| Name | % Weight | Price | % Change |
|---|---|---|---|
| MASSACHUSETTS ST MA 5.000 09/01/2049 | 3.19% | 103.31 | 0.09% |
| MASSACHUSETTS ST MA 5.000 12/01/2037 | 2.37% | 113.29 | 0.14% |
| MASSACHUSETTS ST MA 5.000 11/01/2052 | 2.07% | 102.69 | 0.16% |
| MASSACHUSETTS ST TPK AUTH MET HWY SYS REV MA 0.000 01/01/2029 | 1.90% | 92.72 | 0.01% |
| MASSACHUSETTS ST MA 3.000 02/01/2048 | 1.80% | 75.75 | 0.30% |
| MASSACHUSETTS ST MA 5.000 11/01/2050 | 1.49% | 103.64 | 0.08% |
|
Fidelity Municipal Cash Central Fund
|
1.46% | -- | -- |
| MASSACHUSETTS ST MA 5.250 01/01/2033 | 1.40% | 106.30 | 0.04% |
| MASSACHUSETTS ST MA 5.000 12/01/2036 | 1.33% | 113.92 | 0.14% |
| MASSACHUSETTS ST TRANSN FD REV MA 5.000 06/01/2053 | 1.30% | 103.45 | 0.20% |
Fees & Availability
| Fees | |
| Actual 12B-1 Fee | -- |
| Actual Management Fee | 0.44% |
| Administration Fee | -- |
| Maximum Front Load | -- |
| Maximum Deferred Load | -- |
| Maximum Redemption Fee | 0.00% |
| General Availability | |
| Available for Insurance Product | No |
| Available for RRSP | No |
| Purchase Details | |
| Open to New Investors |
|
| Minimum Initial Investment | 0.00 None |
| Minimum Subsequent Investment | 0.00 None |
Basic Info
| Investment Strategy | |
| The Fund seeks a high level of current income, exempt from federal income tax and Massachusetts personal income tax. Under normal market and economic conditions, the Fund invests at least 80% of assets in investment-grade municipal securities whose interest is exempt from federal and Massachusetts personal income taxes. |
| General | |
| Security Type | Mutual Fund |
| Equity Style | -- |
| Broad Asset Class | Municipal Bond |
| Broad Category | Fixed Income |
| Global Peer Group | Bond USD Municipal |
| Peer Group | Massachusetts Municipal Debt Funds |
| Global Macro | Bond HC |
| US Macro | Single State Municipal Debt Funds |
| YCharts Categorization | -- |
| YCharts Benchmark | -- |
| Prospectus Objective | Massachusetts Municipal Debt Funds |
| Fund Owner Firm Name | Fidelity Investments |
| Broad Asset Class Benchmark Index | |
| ^BBMBTR | 100.0% |
Fundamentals
| General | |
| Distribution Yield | -- |
| Dividend Yield TTM (5-26-26) | 2.71% |
| 30-Day SEC Yield (4-30-26) | 3.21% |
| 7-Day SEC Yield | -- |
| Number of Holdings | 454 |
| Bond | |
| Yield to Maturity (3-31-26) | 3.74% |
| Effective Duration | 7.36 |
| Average Coupon | 4.61% |
| Calculated Average Quality | 2.211 |
| Effective Maturity | 10.40 |
| Nominal Maturity | 14.07 |
| Number of Bond Holdings | 448 |
As of March 31, 2026
Fund Details
| Key Dates | |
| Inception Date | 11/10/1983 |
| Last Annual Report Date | 1/31/2026 |
| Last Prospectus Date | 4/1/2026 |
| Attributes | |
| Index Fund | -- |
| Inverse Fund | No |
| Leveraged Fund | -- |
| Fund of Funds | No |
| Currency Hedged Fund | -- |
| Socially Responsible Fund | No |
Top Portfolio Holders
| Name | % Weight |
|---|---|
| Portfolio A | 5.00% |
| Portfolio B | 3.50% |
| Portfolio C | 2.25% |
Excel Add-In Codes
| Name: =YCI("M:FDMMX", "name") |
| Broad Asset Class: =YCI("M:FDMMX", "broad_asset_class") |
| Broad Category: =YCI("M:FDMMX", "broad_category_group") |
| Prospectus Objective: =YCI("M:FDMMX", "prospectus_objective") |
| To find the codes for any of our securities and financial metrics, see our Complete Excel Reference. |