

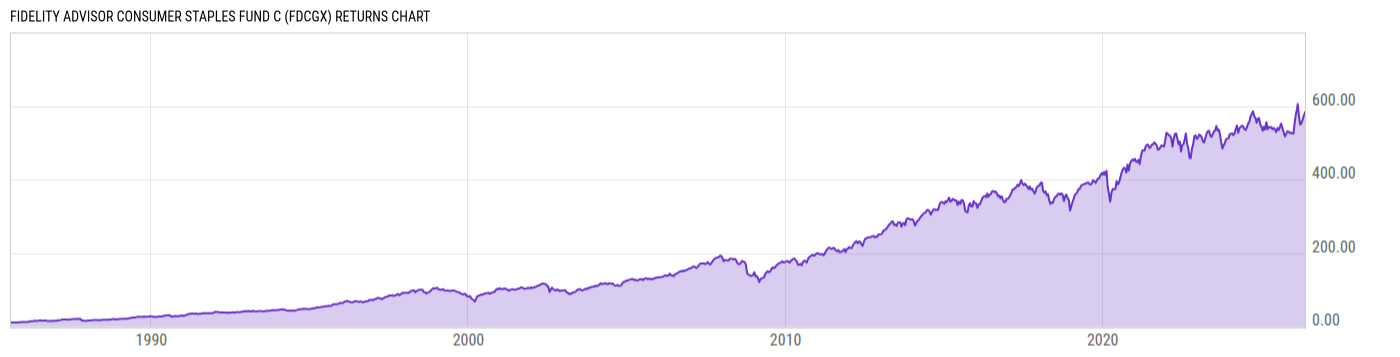
Fidelity Advisor Consumer Staples Fund C (FDCGX)
86.98
+1.11
(+1.29%)
USD |
Jun 09 2026
Returns Chart
Key Stats
| Net Expense Ratio | Total Assets Under Management | Weighted Average Dividend Yield | Turnover Ratio (Generic) |
|---|---|---|---|
| 1.72% | 1.233B | 2.55% | 52.00% |
| 1 Year Fund Level Flows | 1 Year Total Returns (Daily) | Annualized Total Returns Since Inception (Daily) | Max Drawdown (Since Inception) |
| -88.41M | 7.95% |
Basic Info
| Investment Strategy | |
| The Fund seeks capital appreciation. Fidelity Management & Research normally invests at least 80% of the assets in securities of companies engaged in the manufacture, sale, or distribution of food and beverage products, agricultural products, and products related to the development of new food technologies. |
| General | |
| Security Type | Mutual Fund |
| Equity Style | Multi Cap Value |
| Broad Asset Class | Sector Equity |
| Broad Category | Equity |
| Global Peer Group | Equity Sector Consumer Staples |
| Peer Group | Consumer Goods Funds |
| Global Macro | Equity Industry Sector |
| US Macro | Sector Equity Funds |
| YCharts Categorization | -- |
| YCharts Benchmark | -- |
| Prospectus Objective | Consumer Goods Funds |
| Fund Owner Firm Name | Fidelity Investments |
| Broad Asset Class Benchmark Index | |
| ^MSWNTR | 100.0% |
Net Fund Flows Versus Peer Group
1 Month
% Rank:
18
-99.03M
Peer Group Low
501.94M
Peer Group High
1 Year
% Rank:
83
-88.41M
-1.907B
Peer Group Low
121.98M
Peer Group High
3 Months
% Rank:
15
-1.454B
Peer Group Low
342.72M
Peer Group High
3 Years
% Rank:
80
-5.698B
Peer Group Low
57.68M
Peer Group High
6 Months
% Rank:
24
-1.530B
Peer Group Low
203.98M
Peer Group High
5 Years
% Rank:
93
-520.88M
Peer Group Low
986.55M
Peer Group High
YTD
% Rank:
24
-946.29M
Peer Group Low
323.23M
Peer Group High
10 Years
% Rank:
90
-3.345B
Peer Group Low
1.897B
Peer Group High
Date Unavailable
Risk
Performance Versus Peer Group
Annual Total Returns Versus Peers
As of June 11, 2026.
Asset Allocation
As of April 30, 2026.
| Type | % Net |
|---|---|
| Cash | 0.14% |
| Stock | 99.51% |
| Bond | 0.26% |
| Convertible | 0.00% |
| Preferred | 0.00% |
| Other | 0.10% |
Top 10 Holdings
| Name | % Weight | Price | % Change |
|---|---|---|---|
| The Coca-Cola Co. | 13.87% | 83.59 | 2.77% |
| Procter & Gamble Co. | 10.51% | 149.05 | 0.26% |
| Costco Wholesale Corp. | 9.23% | 983.37 | 1.53% |
| Walmart, Inc. | 8.11% | 120.59 | 1.44% |
| Keurig Dr Pepper, Inc. | 7.26% | 31.70 | 0.70% |
| Kenvue, Inc. | 4.96% | 18.05 | 0.73% |
| Mondelez International, Inc. | 4.80% | 64.18 | 1.99% |
| Target Corp. | 4.09% | 127.98 | 1.08% |
| Energizer Holdings, Inc. | 2.68% | 19.40 | -1.42% |
| British American Tobacco plc | 2.68% | 61.12 | 1.95% |
Fees & Availability
| Fees | |
| Actual 12B-1 Fee | 1.00% |
| Actual Management Fee | 0.70% |
| Administration Fee | -- |
| Maximum Front Load | -- |
| Maximum Deferred Load | 1.00% |
| Maximum Redemption Fee | 0.00% |
| General Availability | |
| Available for Insurance Product | No |
| Available for RRSP | No |
| Purchase Details | |
| Open to New Investors |
|
| Minimum Initial Investment | 0.00 None |
| Minimum Subsequent Investment | 0.00 None |
Basic Info
| Investment Strategy | |
| The Fund seeks capital appreciation. Fidelity Management & Research normally invests at least 80% of the assets in securities of companies engaged in the manufacture, sale, or distribution of food and beverage products, agricultural products, and products related to the development of new food technologies. |
| General | |
| Security Type | Mutual Fund |
| Equity Style | Multi Cap Value |
| Broad Asset Class | Sector Equity |
| Broad Category | Equity |
| Global Peer Group | Equity Sector Consumer Staples |
| Peer Group | Consumer Goods Funds |
| Global Macro | Equity Industry Sector |
| US Macro | Sector Equity Funds |
| YCharts Categorization | -- |
| YCharts Benchmark | -- |
| Prospectus Objective | Consumer Goods Funds |
| Fund Owner Firm Name | Fidelity Investments |
| Broad Asset Class Benchmark Index | |
| ^MSWNTR | 100.0% |
Fundamentals
| General | |
| Distribution Yield | -- |
| Dividend Yield TTM (6-8-26) | 0.85% |
| 30-Day SEC Yield (10-3-23) | 0.00% |
| 7-Day SEC Yield (10-3-23) | 0.00% |
| Number of Holdings | 46 |
| Stock | |
| Weighted Average PE Ratio | 30.04 |
| Weighted Average Price to Sales Ratio | 2.860 |
| Weighted Average Price to Book Ratio | 6.787 |
| Weighted Median ROE | 27.01% |
| Weighted Median ROA | 8.17% |
| ROI (TTM) | 11.92% |
| Return on Investment (TTM) | 11.92% |
| Earning Yield | 0.0413 |
| LT Debt / Shareholders Equity | 1.402 |
| Number of Equity Holdings | 44 |
As of April 30, 2026
Growth Metrics
| EPS Growth (1Y) | 16.19% |
| EPS Growth (3Y) | 5.38% |
| EPS Growth (5Y) | 6.39% |
| Sales Growth (1Y) | 4.26% |
| Sales Growth (3Y) | 4.33% |
| Sales Growth (5Y) | 6.45% |
| Sales per Share Growth (1Y) | 4.53% |
| Sales per Share Growth (3Y) | 4.40% |
| Operating Cash Flow - Growth Rate (3Y) | 16.52% |
As of April 30, 2026
Fund Details
Top Portfolio Holders
| Name | % Weight |
|---|---|
| Portfolio A | 5.00% |
| Portfolio B | 3.50% |
| Portfolio C | 2.25% |
Excel Add-In Codes
| Name: =YCI("M:FDCGX", "name") |
| Broad Asset Class: =YCI("M:FDCGX", "broad_asset_class") |
| Broad Category: =YCI("M:FDCGX", "broad_category_group") |
| Prospectus Objective: =YCI("M:FDCGX", "prospectus_objective") |
| To find the codes for any of our securities and financial metrics, see our Complete Excel Reference. |