

Nuveen Strategic Income Fund I (FCBYX)
9.92
+0.01
(+0.10%)
USD |
Jun 04 2026
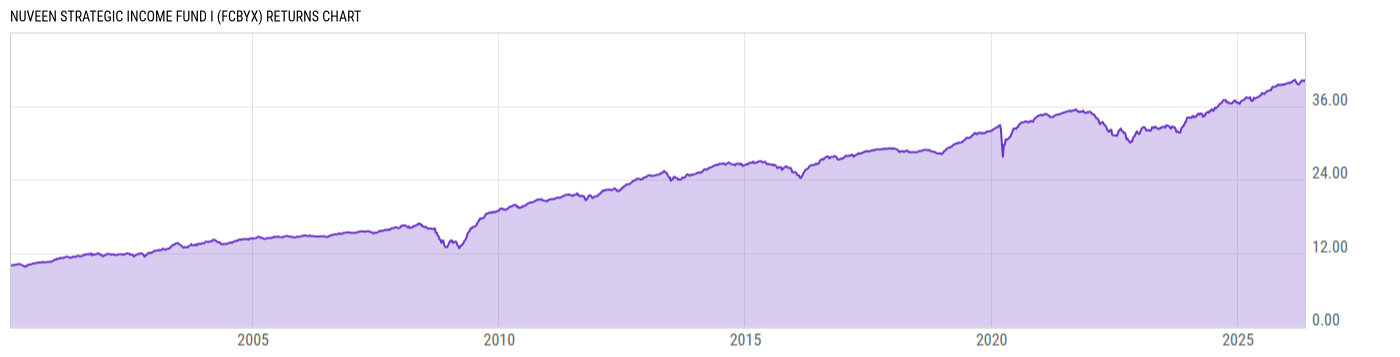
Returns Chart
Key Stats
| Net Expense Ratio | Total Assets Under Management | Weighted Average Dividend Yield | Turnover Ratio (Generic) |
|---|---|---|---|
| 0.55% | 1.405B | -- | 87.00% |
| 1 Year Fund Level Flows | 1 Year Total Returns (Daily) | Annualized Total Returns Since Inception (Daily) | Max Drawdown (Since Inception) |
| 269.85M | 7.04% |
Basic Info
| Investment Strategy | |
| The Fund seeks to provide investors with a high level of current income consistent with prudent risk to capital. The Fund will invest primarily in investment grade debt securities and attempts to maintain a weighted average effective maturity of 15 years or less and an average effective duration of three to eight years. |
| General | |
| Security Type | Mutual Fund |
| Equity Style | -- |
| Broad Asset Class | Taxable Bond |
| Broad Category | Fixed Income |
| Global Peer Group | Bond USD |
| Peer Group | Multi-Sector Income Funds |
| Global Macro | Bond HC |
| US Macro | General Domestic Taxable Fixed Income Funds |
| YCharts Categorization | -- |
| YCharts Benchmark | -- |
| Prospectus Objective | Multi-Sector Income Funds |
| Fund Owner Firm Name | Nuveen |
| Broad Asset Class Benchmark Index | |
| ^BBUSATR | 100.0% |
Net Fund Flows Versus Peer Group
1 Month
% Rank:
30
-118.71M
Peer Group Low
572.86M
Peer Group High
1 Year
% Rank:
25
269.85M
-1.545B
Peer Group Low
30.94B
Peer Group High
3 Months
% Rank:
24
-388.02M
Peer Group Low
1.683B
Peer Group High
3 Years
% Rank:
24
-4.573B
Peer Group Low
71.08B
Peer Group High
6 Months
% Rank:
27
-777.58M
Peer Group Low
12.53B
Peer Group High
5 Years
% Rank:
23
-7.509B
Peer Group Low
61.00B
Peer Group High
YTD
% Rank:
26
-627.92M
Peer Group Low
8.773B
Peer Group High
10 Years
% Rank:
41
-13.91B
Peer Group Low
116.77B
Peer Group High
Date Unavailable
Risk
Performance Versus Peer Group
Annual Total Returns Versus Peers
As of June 05, 2026.
Asset Allocation
As of March 31, 2026.
| Type | % Net |
|---|---|
| Cash | 4.15% |
| Stock | 0.00% |
| Bond | 97.39% |
| Convertible | 0.00% |
| Preferred | 0.28% |
| Other | -1.82% |
Top 10 Holdings
| Name | % Weight | Price | % Change |
|---|---|---|---|
|
Fixed Income Clearing Corp Repo
|
3.80% | -- | -- |
| United States of America USGB 4.625 02/15/2046 FIX USD Government | 1.77% | 95.45 | 0.17% |
| United States of America USGB 4.75 02/15/2056 FIX USD Government | 1.65% | 96.45 | 0.20% |
| United States of America USGB 3.5 12/15/2028 FIX USD Government | 1.39% | 98.60 | 0.07% |
| United States of America USGB 4.625 11/15/2045 FIX USD Government | 0.92% | 95.52 | 0.19% |
| MORGAN STANLEY PRIVATE BANK, NATIONAL ASSOCIATION MORGSTJB 4.465 11/19/2031 FLT USD Corporate '30 | 0.79% | 98.33 | 0.08% |
| United States of America USGB 3.375 02/29/2028 FIX USD Government | 0.62% | 98.91 | 0.06% |
| United States of America USGB 4.125 02/15/2036 FIX USD Government | 0.58% | 97.30 | 0.12% |
|
CONNECTICUT AVENUE SECURITIES TRUST 22R06 1B2 FLT 14.26721% 26-MAY-2042
|
0.48% | -- | -- |
|
CONNECTICUT AVENUE SECURITIES TRUST 23R06 1B2 FLT 9.5619% 27-JUL-2043
|
0.48% | -- | -- |
Fees & Availability
| Fees | |
| Actual 12B-1 Fee | -- |
| Actual Management Fee | 0.42% |
| Administration Fee | -- |
| Maximum Front Load | -- |
| Maximum Deferred Load | -- |
| Maximum Redemption Fee | -- |
| General Availability | |
| Available for Insurance Product | No |
| Available for RRSP | No |
| Purchase Details | |
| Open to New Investors |
|
| Minimum Initial Investment | 100000.0 None |
| Minimum Subsequent Investment | 0.00 None |
Basic Info
| Investment Strategy | |
| The Fund seeks to provide investors with a high level of current income consistent with prudent risk to capital. The Fund will invest primarily in investment grade debt securities and attempts to maintain a weighted average effective maturity of 15 years or less and an average effective duration of three to eight years. |
| General | |
| Security Type | Mutual Fund |
| Equity Style | -- |
| Broad Asset Class | Taxable Bond |
| Broad Category | Fixed Income |
| Global Peer Group | Bond USD |
| Peer Group | Multi-Sector Income Funds |
| Global Macro | Bond HC |
| US Macro | General Domestic Taxable Fixed Income Funds |
| YCharts Categorization | -- |
| YCharts Benchmark | -- |
| Prospectus Objective | Multi-Sector Income Funds |
| Fund Owner Firm Name | Nuveen |
| Broad Asset Class Benchmark Index | |
| ^BBUSATR | 100.0% |
Fundamentals
| General | |
| Distribution Yield | -- |
| Dividend Yield TTM (6-3-26) | 5.86% |
| 30-Day SEC Yield (4-30-26) | 5.64% |
| 7-Day SEC Yield | -- |
| Number of Holdings | 691 |
| Bond | |
| Yield to Maturity (3-31-26) | 5.94% |
| Effective Duration | 4.33 |
| Average Coupon | 6.11% |
| Calculated Average Quality | 4.022 |
| Effective Maturity | 16.70 |
| Nominal Maturity | 17.55 |
| Number of Bond Holdings | 643 |
As of March 31, 2026
Fund Details
Top Portfolio Holders
| Name | % Weight |
|---|---|
| Portfolio A | 5.00% |
| Portfolio B | 3.50% |
| Portfolio C | 2.25% |
Excel Add-In Codes
| Name: =YCI("M:FCBYX", "name") |
| Broad Asset Class: =YCI("M:FCBYX", "broad_asset_class") |
| Broad Category: =YCI("M:FCBYX", "broad_category_group") |
| Prospectus Objective: =YCI("M:FCBYX", "prospectus_objective") |
| To find the codes for any of our securities and financial metrics, see our Complete Excel Reference. |