

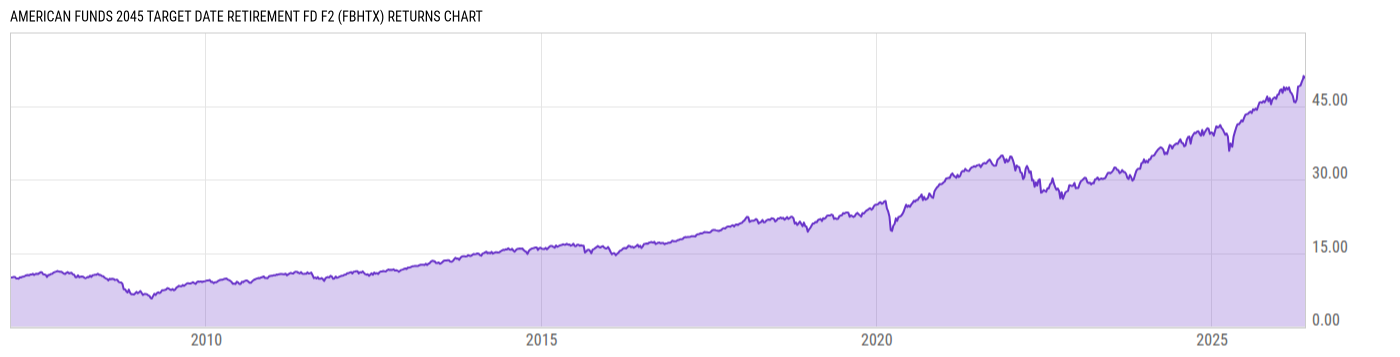
American Funds 2045 Target Date Retirement Fd F2 (FBHTX)
25.78
+0.03
(+0.12%)
USD |
May 22 2026
Returns Chart
Key Stats
| Net Expense Ratio | Total Assets Under Management | Weighted Average Dividend Yield | Turnover Ratio (Generic) |
|---|---|---|---|
| 0.45% | 46.60B | -- | 9.00% |
| 1 Year Fund Level Flows | 1 Year Total Returns (Daily) | Annualized Total Returns Since Inception (Daily) | Max Drawdown (Since Inception) |
| -1.422B | 24.75% |
Basic Info
| Investment Strategy | |
| The Fund seeks to provide for investors that plan to retire in 2045. Depending on its proximity to its target date, the Fund will seek to achieve the following: growth, income and conservation of capital. Each Fund will attempt to achieve its investment objectives by investing in a mix of American Funds. |
| General | |
| Security Type | Mutual Fund |
| Equity Style | -- |
| Broad Asset Class | Allocation |
| Broad Category | Allocation |
| Global Peer Group | Target Maturity MA USD 2045 |
| Peer Group | Mixed-Asset Target 2045 Funds |
| Global Macro | Target Maturity |
| US Macro | Mixed-Assets Target Date Funds |
| YCharts Categorization | -- |
| YCharts Benchmark | -- |
| Prospectus Objective | Growth Funds |
| Fund Owner Firm Name | Capital Group/American Funds |
| Broad Asset Class Benchmark Index | |
| ^SPXTR | 100.0% |
Net Fund Flows Versus Peer Group
1 Month
% Rank:
95
-253.06M
Peer Group Low
348.54M
Peer Group High
1 Year
% Rank:
95
-1.422B
-1.659B
Peer Group Low
2.951B
Peer Group High
3 Months
% Rank:
97
-365.32M
Peer Group Low
1.279B
Peer Group High
3 Years
% Rank:
7
-2.489B
Peer Group Low
7.130B
Peer Group High
6 Months
% Rank:
87
-974.63M
Peer Group Low
1.948B
Peer Group High
5 Years
% Rank:
6
-4.211B
Peer Group Low
11.89B
Peer Group High
YTD
% Rank:
86
-767.58M
Peer Group Low
1.576B
Peer Group High
10 Years
% Rank:
4
-9.109B
Peer Group Low
19.26B
Peer Group High
Date Unavailable
Risk
Performance Versus Peer Group
Annual Total Returns Versus Peers
As of May 23, 2026.
Asset Allocation
As of March 31, 2026.
| Type | % Net |
|---|---|
| Cash | 3.12% |
| Stock | 84.88% |
| Bond | 11.04% |
| Convertible | 0.00% |
| Preferred | 0.48% |
| Other | 0.49% |
Top 10 Holdings
| Name | % Weight | Price | % Change |
|---|---|---|---|
| American Funds American Balanced Fund R6 | 7.69% | 40.36 | 0.02% |
| American Funds Fundamental Investors R6 | 7.67% | 102.91 | 0.03% |
| American Funds Capital World Gro & Inc Fd R6 | 7.11% | 80.23 | 0.24% |
| American Funds American Mutual Fund R6 | 7.06% | 63.08 | 0.54% |
| American Funds Growth Fund of America R6 | 7.04% | 86.02 | -0.17% |
| American Funds New Perspective Fund R6 | 6.99% | 73.96 | 0.11% |
| American Funds AMCAP Fund R6 | 6.96% | 49.35 | 0.12% |
| American Funds SMALLCAP World Fund R6 | 6.85% | 85.29 | 0.68% |
| American Funds Washington Mutual Inv Fund R6 | 6.80% | 68.45 | 0.35% |
| American Funds New World Fund R6 | 5.59% | 104.83 | -0.07% |
Fees & Availability
| Fees | |
| Actual 12B-1 Fee | -- |
| Actual Management Fee | 0.00% |
| Administration Fee | -- |
| Maximum Front Load | -- |
| Maximum Deferred Load | -- |
| Maximum Redemption Fee | -- |
| General Availability | |
| Available for Insurance Product | No |
| Available for RRSP | No |
| Purchase Details | |
| Open to New Investors |
|
| Minimum Initial Investment | 250.00 None |
| Minimum Subsequent Investment | 50.00 None |
Basic Info
| Investment Strategy | |
| The Fund seeks to provide for investors that plan to retire in 2045. Depending on its proximity to its target date, the Fund will seek to achieve the following: growth, income and conservation of capital. Each Fund will attempt to achieve its investment objectives by investing in a mix of American Funds. |
| General | |
| Security Type | Mutual Fund |
| Equity Style | -- |
| Broad Asset Class | Allocation |
| Broad Category | Allocation |
| Global Peer Group | Target Maturity MA USD 2045 |
| Peer Group | Mixed-Asset Target 2045 Funds |
| Global Macro | Target Maturity |
| US Macro | Mixed-Assets Target Date Funds |
| YCharts Categorization | -- |
| YCharts Benchmark | -- |
| Prospectus Objective | Growth Funds |
| Fund Owner Firm Name | Capital Group/American Funds |
| Broad Asset Class Benchmark Index | |
| ^SPXTR | 100.0% |
Fundamentals
| General | |
| Distribution Yield | -- |
| Dividend Yield TTM (5-21-26) | 0.91% |
| 30-Day SEC Yield (4-30-26) | 1.44% |
| 7-Day SEC Yield | -- |
| Number of Holdings | 26 |
| Stock | |
| Weighted Average PE Ratio | 32.14 |
| Weighted Average Price to Sales Ratio | 8.049 |
| Weighted Average Price to Book Ratio | 9.279 |
| Weighted Median ROE | 95.89% |
| Weighted Median ROA | 12.89% |
| ROI (TTM) | 18.59% |
| Return on Investment (TTM) | 18.59% |
| Earning Yield | 0.0405 |
| LT Debt / Shareholders Equity | 1.117 |
| Number of Equity Holdings | 0 |
| Bond | |
| Yield to Maturity (3-31-26) | 4.37% |
| Effective Duration | 6.40 |
| Average Coupon | 4.35% |
| Calculated Average Quality | 2.734 |
| Effective Maturity | 13.46 |
| Nominal Maturity | 13.54 |
| Number of Bond Holdings | 0 |
As of March 31, 2026
Growth Metrics
| EPS Growth (1Y) | 30.30% |
| EPS Growth (3Y) | 16.73% |
| EPS Growth (5Y) | 21.41% |
| Sales Growth (1Y) | 15.88% |
| Sales Growth (3Y) | 13.77% |
| Sales Growth (5Y) | 14.15% |
| Sales per Share Growth (1Y) | 16.85% |
| Sales per Share Growth (3Y) | 13.83% |
| Operating Cash Flow - Growth Rate (3Y) | 18.49% |
As of March 31, 2026
Fund Details
| Key Dates | |
| Inception Date | 2/1/2007 |
| Last Annual Report Date | 10/31/2025 |
| Last Prospectus Date | 1/1/2026 |
| Share Classes | |
| AAHTX | A |
| CCHTX | C |
| FATTX | Other |
| FCHTX | F3 |
| RAHTX | Retirement |
| RBHHX | Other |
| RBHTX | Retirement |
| RCHTX | Retirement |
| RDHTX | Retirement |
| REHTX | Retirement |
| RFHTX | Retirement |
| RHHTX | Other |
| Attributes | |
| Index Fund | -- |
| Inverse Fund | No |
| Leveraged Fund | -- |
| Fund of Funds |
|
| Currency Hedged Fund | -- |
| Socially Responsible Fund | No |
Top Portfolio Holders
| Name | % Weight |
|---|---|
| Portfolio A | 5.00% |
| Portfolio B | 3.50% |
| Portfolio C | 2.25% |
Excel Add-In Codes
| Name: =YCI("M:FBHTX", "name") |
| Broad Asset Class: =YCI("M:FBHTX", "broad_asset_class") |
| Broad Category: =YCI("M:FBHTX", "broad_category_group") |
| Prospectus Objective: =YCI("M:FBHTX", "prospectus_objective") |
| To find the codes for any of our securities and financial metrics, see our Complete Excel Reference. |