

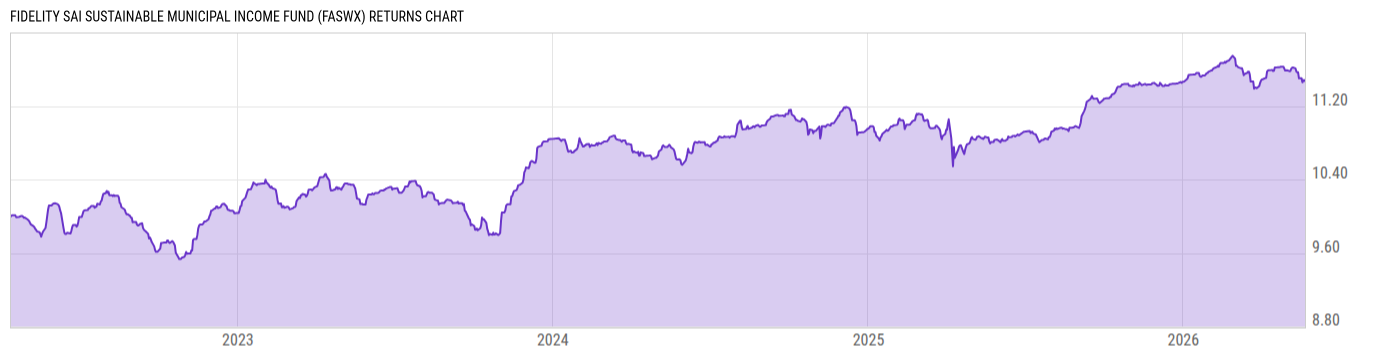
Fidelity SAI Sustainable Municipal Income Fund (FASWX)
10.10
+0.01
(+0.10%)
USD |
May 22 2026
Returns Chart
Key Stats
| Net Expense Ratio | Total Assets Under Management | Weighted Average Dividend Yield | Turnover Ratio (Generic) |
|---|---|---|---|
| 0.36% | 84.98M | -- | 10.00% |
| 1 Year Fund Level Flows | 1 Year Total Returns (Daily) | Annualized Total Returns Since Inception (Daily) | Max Drawdown (Since Inception) |
| 38.76M | 6.39% |
Basic Info
| Investment Strategy | |
| The Fund seeks to provide high current yield exempt from federal income tax. It invests at least 80% of assets in investment-grade municipal securities whose interest is exempt from federal income tax and that Fidelity Management & Research Company LLC believes have positive environmental, social and governance benefits. |
| General | |
| Security Type | Mutual Fund |
| Equity Style | -- |
| Broad Asset Class | Municipal Bond |
| Broad Category | Fixed Income |
| Global Peer Group | Bond USD Municipal |
| Peer Group | General & Insured Municipal Debt Funds |
| Global Macro | Bond HC |
| US Macro | National Municipal Debt Funds |
| YCharts Categorization | -- |
| YCharts Benchmark | -- |
| Prospectus Objective | General & Insured Municipal Debt Funds |
| Fund Owner Firm Name | Fidelity Investments |
| Broad Asset Class Benchmark Index | |
| ^BBMBTR | 100.0% |
Net Fund Flows Versus Peer Group
1 Month
% Rank:
22
-99.16M
Peer Group Low
809.96M
Peer Group High
1 Year
% Rank:
33
38.76M
-752.82M
Peer Group Low
6.079B
Peer Group High
3 Months
% Rank:
33
-397.00M
Peer Group Low
1.450B
Peer Group High
3 Years
% Rank:
36
-4.696B
Peer Group Low
16.26B
Peer Group High
6 Months
% Rank:
35
-636.26M
Peer Group Low
2.119B
Peer Group High
5 Years
% Rank:
37
-8.303B
Peer Group Low
33.26B
Peer Group High
YTD
% Rank:
32
-391.95M
Peer Group Low
1.826B
Peer Group High
10 Years
% Rank:
51
-7.392B
Peer Group Low
45.51B
Peer Group High
Date Unavailable
Risk
Performance Versus Peer Group
Annual Total Returns Versus Peers
As of May 23, 2026.
Asset Allocation
As of March 31, 2026.
| Type | % Net |
|---|---|
| Cash | 0.00% |
| Stock | 0.00% |
| Bond | 99.24% |
| Convertible | 0.00% |
| Preferred | 0.00% |
| Other | 0.76% |
Top 10 Holdings
| Name | % Weight | Price | % Change |
|---|---|---|---|
| OKLAHOMA HSG FIN AGY SINGLE FAMILY MTG REV OK 4.750 09/01/2051 | 1.86% | 98.61 | 0.28% |
| COLORADO ST CTFS PARTN CO 5.000 11/01/2049 | 1.81% | 104.49 | 0.13% |
| NORTH CAROLINA MED CARE COMMN HEALTH CARE FACS REV NC 3.000 07/01/2045 | 1.78% | 77.57 | 0.28% |
| MONTANA ST BRD HSG SINGLE FAMILY MTG MT 4.650 12/01/2046 | 1.50% | 99.51 | 0.25% |
| MARYLAND ST MD 5.000 06/01/2037 | 1.50% | 112.34 | 0.12% |
| BARTOW CNTY GA DEV AUTH SOLID WASTE DISP FAC REV GA 2.080 11/01/2062 | 1.46% | 100.00 | 0.00% |
| HARRIS CNTY TEX CULTURAL ED FACS FIN CORP REV TX 5.000 12/01/2033 | 1.41% | 110.82 | 0.13% |
| UNIVERSITY TEX UNIV REVS TX 5.000 08/15/2043 | 1.38% | 109.14 | 0.16% |
| MASSACHUSETTS ST CLEAN WTR TR MA 5.000 02/01/2045 | 1.36% | 108.84 | 0.15% |
| NEW YORK N Y CITY MUN WTR FIN AUTH WTR & SWR SYS REV NY 5.500 06/15/2056 | 1.34% | 106.93 | 0.23% |
Fees & Availability
| Fees | |
| Actual 12B-1 Fee | -- |
| Actual Management Fee | 0.16% |
| Administration Fee | -- |
| Maximum Front Load | -- |
| Maximum Deferred Load | -- |
| Maximum Redemption Fee | -- |
| General Availability | |
| Available for Insurance Product | No |
| Available for RRSP | No |
| Purchase Details | |
| Open to New Investors |
|
| Minimum Initial Investment | 0.00 None |
| Minimum Subsequent Investment | 0.00 None |
Basic Info
| Investment Strategy | |
| The Fund seeks to provide high current yield exempt from federal income tax. It invests at least 80% of assets in investment-grade municipal securities whose interest is exempt from federal income tax and that Fidelity Management & Research Company LLC believes have positive environmental, social and governance benefits. |
| General | |
| Security Type | Mutual Fund |
| Equity Style | -- |
| Broad Asset Class | Municipal Bond |
| Broad Category | Fixed Income |
| Global Peer Group | Bond USD Municipal |
| Peer Group | General & Insured Municipal Debt Funds |
| Global Macro | Bond HC |
| US Macro | National Municipal Debt Funds |
| YCharts Categorization | -- |
| YCharts Benchmark | -- |
| Prospectus Objective | General & Insured Municipal Debt Funds |
| Fund Owner Firm Name | Fidelity Investments |
| Broad Asset Class Benchmark Index | |
| ^BBMBTR | 100.0% |
Fundamentals
| General | |
| Distribution Yield | -- |
| Dividend Yield TTM (5-21-26) | 3.28% |
| 30-Day SEC Yield (4-30-26) | 3.32% |
| 7-Day SEC Yield | -- |
| Number of Holdings | 422 |
| Bond | |
| Yield to Maturity (3-31-26) | 3.87% |
| Effective Duration | -- |
| Average Coupon | 4.41% |
| Calculated Average Quality | 2.154 |
| Effective Maturity | 14.05 |
| Nominal Maturity | 16.53 |
| Number of Bond Holdings | 413 |
As of March 31, 2026
Fund Details
| Key Dates | |
| Inception Date | 4/13/2022 |
| Last Annual Report Date | 1/31/2026 |
| Last Prospectus Date | 4/1/2026 |
| Attributes | |
| Index Fund | -- |
| Inverse Fund | No |
| Leveraged Fund | -- |
| Fund of Funds | No |
| Currency Hedged Fund | -- |
| Socially Responsible Fund |
|
Top Portfolio Holders
| Name | % Weight |
|---|---|
| Portfolio A | 5.00% |
| Portfolio B | 3.50% |
| Portfolio C | 2.25% |
Excel Add-In Codes
| Name: =YCI("M:FASWX", "name") |
| Broad Asset Class: =YCI("M:FASWX", "broad_asset_class") |
| Broad Category: =YCI("M:FASWX", "broad_category_group") |
| Prospectus Objective: =YCI("M:FASWX", "prospectus_objective") |
| To find the codes for any of our securities and financial metrics, see our Complete Excel Reference. |