

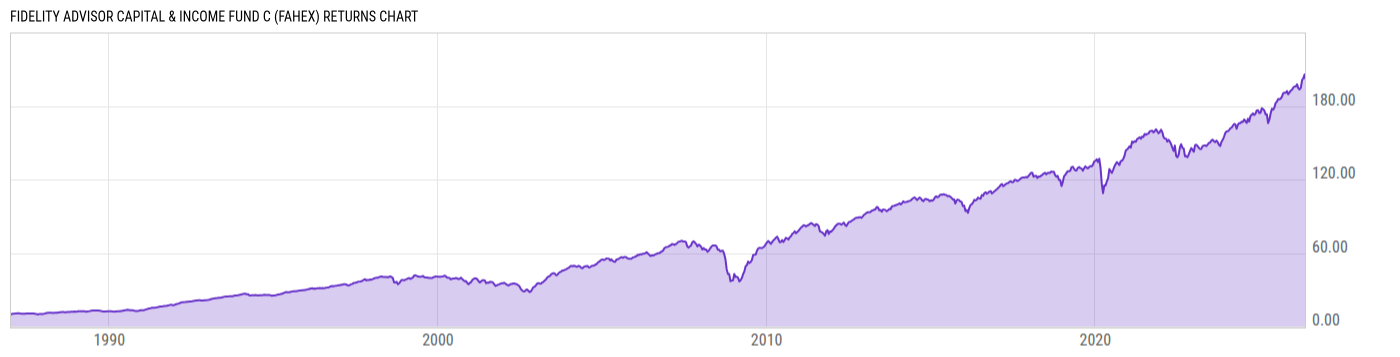
Fidelity Advisor Capital & Income Fund C (FAHEX)
13.18
-0.02
(-0.15%)
USD |
Jun 09 2026
Returns Chart
Key Stats
| Net Expense Ratio | Total Assets Under Management | Weighted Average Dividend Yield | Turnover Ratio (Generic) |
|---|---|---|---|
| 1.93% | 2.997B | -- | 22.00% |
| 1 Year Fund Level Flows | 1 Year Total Returns (Daily) | Annualized Total Returns Since Inception (Daily) | Max Drawdown (Since Inception) |
| 345.18M | 14.20% |
Basic Info
| Investment Strategy | |
| The Fund seeks a combination of a high level of income and the potential for capital gains. The Fund will invest primarily in income-producing debt securities, preferred stocks, and convertible securities, with an emphasis on lower-quality debt securities or those of less than investment-grade quality. |
| General | |
| Security Type | Mutual Fund |
| Equity Style | -- |
| Broad Asset Class | Taxable Bond |
| Broad Category | Fixed Income |
| Global Peer Group | Bond USD High Yield |
| Peer Group | High Yield Funds |
| Global Macro | Bond High Yield |
| US Macro | High Yield Funds |
| YCharts Categorization | -- |
| YCharts Benchmark | -- |
| Prospectus Objective | High Yield Funds |
| Fund Owner Firm Name | Fidelity Investments |
| Broad Asset Class Benchmark Index | |
| ^BBUSATR | 100.0% |
Net Fund Flows Versus Peer Group
1 Month
% Rank:
12
-2.560B
Peer Group Low
510.03M
Peer Group High
1 Year
% Rank:
12
345.18M
-2.841B
Peer Group Low
12.05B
Peer Group High
3 Months
% Rank:
11
-2.713B
Peer Group Low
900.82M
Peer Group High
3 Years
% Rank:
15
-4.326B
Peer Group Low
13.55B
Peer Group High
6 Months
% Rank:
11
-2.877B
Peer Group Low
1.301B
Peer Group High
5 Years
% Rank:
12
-9.174B
Peer Group Low
14.79B
Peer Group High
YTD
% Rank:
11
-4.190B
Peer Group Low
1.217B
Peer Group High
10 Years
% Rank:
53
-9.701B
Peer Group Low
21.92B
Peer Group High
Date Unavailable
Risk
Performance Versus Peer Group
Annual Total Returns Versus Peers
As of June 10, 2026.
Asset Allocation
As of March 31, 2026.
| Type | % Net |
|---|---|
| Cash | 7.93% |
| Stock | 18.98% |
| Bond | 67.90% |
| Convertible | 0.00% |
| Preferred | 1.76% |
| Other | 3.42% |
Top 10 Holdings
| Name | % Weight | Price | % Change |
|---|---|---|---|
|
Fidelity Cash Central Fund
|
19.57% | -- | -- |
| iShares Broad USD High Yield Corporate Bond ETF | 2.98% | 36.84 | -0.01% |
|
Fidelity Private Credit Fund
|
2.19% | -- | -- |
| Comfort Systems USA, Inc. | 1.68% | 1821.94 | -0.53% |
| NVIDIA Corp. | 1.41% | 206.18 | -0.97% |
| Taiwan Semiconductor Manufacturing Co., Ltd. | 1.23% | 424.84 | -0.72% |
| ENERGY TRANSFER LP ENERTRAE 7.125 12/31/2099 FLT USD Corporate '30 | 1.04% | 104.02 | -0.01% |
| Alphabet, Inc. | 0.94% | 365.72 | 0.40% |
| Meta Platforms, Inc. | 0.93% | 583.52 | -0.18% |
| EchoStar Corporation ECHO 10.75 11/30/2029 FIX USD Corporate | 0.91% | 108.42 | -0.05% |
Fees & Availability
| Fees | |
| Actual 12B-1 Fee | 1.00% |
| Actual Management Fee | 0.69% |
| Administration Fee | -- |
| Maximum Front Load | -- |
| Maximum Deferred Load | 1.00% |
| Maximum Redemption Fee | 0.00% |
| General Availability | |
| Available for Insurance Product | No |
| Available for RRSP | No |
| Purchase Details | |
| Open to New Investors |
|
| Minimum Initial Investment | 0.00 None |
| Minimum Subsequent Investment | 0.00 None |
Basic Info
| Investment Strategy | |
| The Fund seeks a combination of a high level of income and the potential for capital gains. The Fund will invest primarily in income-producing debt securities, preferred stocks, and convertible securities, with an emphasis on lower-quality debt securities or those of less than investment-grade quality. |
| General | |
| Security Type | Mutual Fund |
| Equity Style | -- |
| Broad Asset Class | Taxable Bond |
| Broad Category | Fixed Income |
| Global Peer Group | Bond USD High Yield |
| Peer Group | High Yield Funds |
| Global Macro | Bond High Yield |
| US Macro | High Yield Funds |
| YCharts Categorization | -- |
| YCharts Benchmark | -- |
| Prospectus Objective | High Yield Funds |
| Fund Owner Firm Name | Fidelity Investments |
| Broad Asset Class Benchmark Index | |
| ^BBUSATR | 100.0% |
Fundamentals
| General | |
| Distribution Yield | -- |
| Dividend Yield TTM (6-8-26) | 3.41% |
| 30-Day SEC Yield (5-31-26) | 2.98% |
| 7-Day SEC Yield | -- |
| Number of Holdings | 703 |
| Stock | |
| Weighted Average PE Ratio | -- |
| Weighted Average Price to Sales Ratio | -- |
| Weighted Average Price to Book Ratio | -- |
| Weighted Median ROE | -- |
| Weighted Median ROA | -- |
| ROI (TTM) | -- |
| Return on Investment (TTM) | -- |
| Earning Yield | -- |
| LT Debt / Shareholders Equity | -- |
| Number of Equity Holdings | 86 |
| Bond | |
| Yield to Maturity (3-31-26) | 6.48% |
| Effective Duration | -- |
| Average Coupon | 6.77% |
| Calculated Average Quality | 5.626 |
| Effective Maturity | 4.859 |
| Nominal Maturity | 7.340 |
| Number of Bond Holdings | 605 |
As of March 31, 2026
Growth Metrics
| EPS Growth (1Y) | -- |
| EPS Growth (3Y) | -- |
| EPS Growth (5Y) | -- |
| Sales Growth (1Y) | -- |
| Sales Growth (3Y) | -- |
| Sales Growth (5Y) | -- |
| Sales per Share Growth (1Y) | -- |
| Sales per Share Growth (3Y) | -- |
| Operating Cash Flow - Growth Rate (3Y) | -- |
As of March 31, 2026
Top Portfolio Holders
| Name | % Weight |
|---|---|
| Portfolio A | 5.00% |
| Portfolio B | 3.50% |
| Portfolio C | 2.25% |
Excel Add-In Codes
| Name: =YCI("M:FAHEX", "name") |
| Broad Asset Class: =YCI("M:FAHEX", "broad_asset_class") |
| Broad Category: =YCI("M:FAHEX", "broad_category_group") |
| Prospectus Objective: =YCI("M:FAHEX", "prospectus_objective") |
| To find the codes for any of our securities and financial metrics, see our Complete Excel Reference. |