

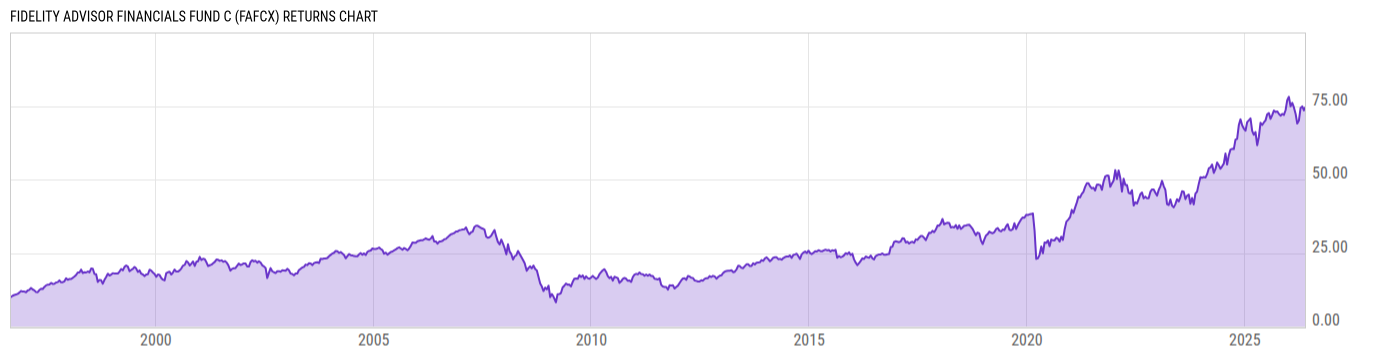
Fidelity Advisor Financials Fund C (FAFCX)
34.03
+0.09
(+0.27%)
USD |
May 21 2026
Returns Chart
Key Stats
| Net Expense Ratio | Total Assets Under Management | Weighted Average Dividend Yield | Turnover Ratio (Generic) |
|---|---|---|---|
| 1.75% | 626.77M | 2.16% | 49.00% |
| 1 Year Fund Level Flows | 1 Year Total Returns (Daily) | Annualized Total Returns Since Inception (Daily) | Max Drawdown (Since Inception) |
| -107.97M | 10.49% |
Basic Info
| Investment Strategy | |
| The Fund seeks capital appreciation. The Fund normally invests at least 80% of assets in securities of companies principally engaged in providing financial services to consumers and industry, while using fundamental analysis of factors such as issuer's financial condition and industry position, to select investments. |
| General | |
| Security Type | Mutual Fund |
| Equity Style | Multi Cap Value |
| Broad Asset Class | Sector Equity |
| Broad Category | Equity |
| Global Peer Group | Equity Sector Financials |
| Peer Group | Financial Services Funds |
| Global Macro | Equity Industry Sector |
| US Macro | Sector Equity Funds |
| YCharts Categorization | -- |
| YCharts Benchmark | -- |
| Prospectus Objective | Financial Services Funds |
| Fund Owner Firm Name | Fidelity Investments |
| Broad Asset Class Benchmark Index | |
| ^MSWNTR | 100.0% |
Net Fund Flows Versus Peer Group
1 Month
% Rank:
90
-532.02M
Peer Group Low
982.86M
Peer Group High
1 Year
% Rank:
81
-107.97M
-2.252B
Peer Group Low
265.03M
Peer Group High
3 Months
% Rank:
86
-2.775B
Peer Group Low
85.47M
Peer Group High
3 Years
% Rank:
72
-704.56M
Peer Group Low
2.009B
Peer Group High
6 Months
% Rank:
79
-1.361B
Peer Group Low
427.18M
Peer Group High
5 Years
% Rank:
43
-5.999B
Peer Group Low
1.667B
Peer Group High
YTD
% Rank:
85
-1.057B
Peer Group Low
725.48M
Peer Group High
10 Years
% Rank:
33
-2.965B
Peer Group Low
3.118B
Peer Group High
Date Unavailable
Risk
Performance Versus Peer Group
Annual Total Returns Versus Peers
As of May 22, 2026.
Asset Allocation
As of March 31, 2026.
| Type | % Net |
|---|---|
| Cash | 0.00% |
| Stock | 105.1% |
| Bond | 0.00% |
| Convertible | 0.00% |
| Preferred | 0.00% |
| Other | -5.09% |
Top 10 Holdings
| Name | % Weight | Price | % Change |
|---|---|---|---|
| Mastercard, Inc. | 9.65% | 498.61 | -0.20% |
| Wells Fargo & Co. | 6.80% | 76.40 | 0.63% |
| Bank of America Corp. | 6.35% | 51.79 | 0.58% |
| Citigroup, Inc. | 4.03% | 125.09 | -0.10% |
| Reinsurance Group of America, Inc. | 3.88% | 213.98 | -0.55% |
| State Street Corp. | 3.47% | 153.96 | 0.18% |
| The Charles Schwab Corp. | 3.34% | 90.15 | -0.29% |
| Chubb Ltd. | 3.07% | 327.85 | -0.73% |
| KKR & Co., Inc. | 2.84% | 94.02 | -0.78% |
| Morgan Stanley | 2.69% | 201.07 | 0.28% |
Fees & Availability
| Fees | |
| Actual 12B-1 Fee | 1.00% |
| Actual Management Fee | 0.71% |
| Administration Fee | -- |
| Maximum Front Load | -- |
| Maximum Deferred Load | 1.00% |
| Maximum Redemption Fee | 0.00% |
| General Availability | |
| Available for Insurance Product | No |
| Available for RRSP | No |
| Purchase Details | |
| Open to New Investors |
|
| Minimum Initial Investment | 0.00 None |
| Minimum Subsequent Investment | 0.00 None |
Basic Info
| Investment Strategy | |
| The Fund seeks capital appreciation. The Fund normally invests at least 80% of assets in securities of companies principally engaged in providing financial services to consumers and industry, while using fundamental analysis of factors such as issuer's financial condition and industry position, to select investments. |
| General | |
| Security Type | Mutual Fund |
| Equity Style | Multi Cap Value |
| Broad Asset Class | Sector Equity |
| Broad Category | Equity |
| Global Peer Group | Equity Sector Financials |
| Peer Group | Financial Services Funds |
| Global Macro | Equity Industry Sector |
| US Macro | Sector Equity Funds |
| YCharts Categorization | -- |
| YCharts Benchmark | -- |
| Prospectus Objective | Financial Services Funds |
| Fund Owner Firm Name | Fidelity Investments |
| Broad Asset Class Benchmark Index | |
| ^MSWNTR | 100.0% |
Fundamentals
| General | |
| Distribution Yield | -- |
| Dividend Yield TTM (5-20-26) | 0.62% |
| 30-Day SEC Yield (10-3-23) | 0.00% |
| 7-Day SEC Yield (10-3-23) | 0.00% |
| Number of Holdings | 61 |
| Stock | |
| Weighted Average PE Ratio | 19.15 |
| Weighted Average Price to Sales Ratio | 3.050 |
| Weighted Average Price to Book Ratio | 4.349 |
| Weighted Median ROE | 32.02% |
| Weighted Median ROA | 4.97% |
| ROI (TTM) | 15.90% |
| Return on Investment (TTM) | 15.90% |
| Earning Yield | 0.0662 |
| LT Debt / Shareholders Equity | 0.8951 |
| Number of Equity Holdings | 58 |
As of March 31, 2026
Growth Metrics
| EPS Growth (1Y) | 20.03% |
| EPS Growth (3Y) | 9.96% |
| EPS Growth (5Y) | 18.70% |
| Sales Growth (1Y) | 12.33% |
| Sales Growth (3Y) | 12.16% |
| Sales Growth (5Y) | 12.32% |
| Sales per Share Growth (1Y) | 10.74% |
| Sales per Share Growth (3Y) | 12.17% |
| Operating Cash Flow - Growth Rate (3Y) | 23.03% |
As of March 31, 2026
Fund Details
Top Portfolio Holders
| Name | % Weight |
|---|---|
| Portfolio A | 5.00% |
| Portfolio B | 3.50% |
| Portfolio C | 2.25% |
Excel Add-In Codes
| Name: =YCI("M:FAFCX", "name") |
| Broad Asset Class: =YCI("M:FAFCX", "broad_asset_class") |
| Broad Category: =YCI("M:FAFCX", "broad_category_group") |
| Prospectus Objective: =YCI("M:FAFCX", "prospectus_objective") |
| To find the codes for any of our securities and financial metrics, see our Complete Excel Reference. |