

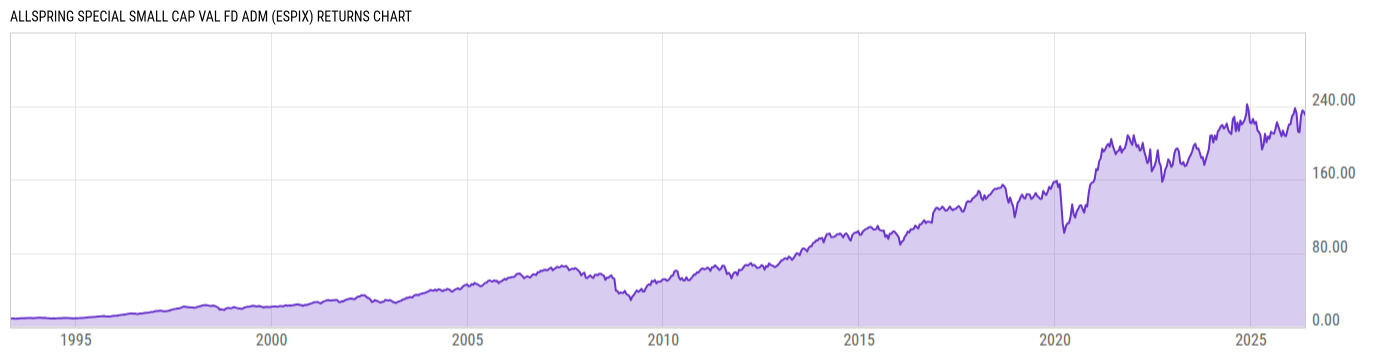
Allspring Special Small Cap Val Fd Adm (ESPIX)
40.13
+0.61
(+1.54%)
USD |
Jun 09 2026
Returns Chart
Key Stats
| Net Expense Ratio | Total Assets Under Management | Weighted Average Dividend Yield | Turnover Ratio (Generic) |
|---|---|---|---|
| 1.17% | 2.944B | 1.52% | 22.00% |
| 1 Year Fund Level Flows | 1 Year Total Returns (Daily) | Annualized Total Returns Since Inception (Daily) | Max Drawdown (Since Inception) |
| -1.861B | 15.49% |
Basic Info
| Investment Strategy | |
| The Fund seeks to produce growth of capital by investing primarily in common stocks of small U.S. companies. |
| General | |
| Security Type | Mutual Fund |
| Equity Style | Small Cap Value |
| Broad Asset Class | US Equity |
| Broad Category | Equity |
| Global Peer Group | Equity US Sm&Mid Cap |
| Peer Group | Small-Cap Value Funds |
| Global Macro | Equity North America |
| US Macro | Small-Cap Funds |
| YCharts Categorization | -- |
| YCharts Benchmark | -- |
| Prospectus Objective | Small-Cap Funds |
| Fund Owner Firm Name | Allspring |
| Broad Asset Class Benchmark Index | |
| ^SPXTR | 100.0% |
Net Fund Flows Versus Peer Group
1 Month
% Rank:
100
-194.31M
Peer Group Low
932.86M
Peer Group High
1 Year
% Rank:
100
-1.861B
-1.861B
Peer Group Low
5.278B
Peer Group High
3 Months
% Rank:
100
-525.38M
Peer Group Low
1.949B
Peer Group High
3 Years
% Rank:
100
-3.371B
Peer Group Low
13.71B
Peer Group High
6 Months
% Rank:
96
-1.112B
Peer Group Low
3.623B
Peer Group High
5 Years
% Rank:
99
-6.954B
Peer Group Low
18.14B
Peer Group High
YTD
% Rank:
100
-873.19M
Peer Group Low
3.299B
Peer Group High
10 Years
% Rank:
78
-9.988B
Peer Group Low
19.03B
Peer Group High
Date Unavailable
Risk
Performance Versus Peer Group
Annual Total Returns Versus Peers
As of June 10, 2026.
Asset Allocation
As of April 30, 2026.
| Type | % Net |
|---|---|
| Cash | 0.73% |
| Stock | 98.23% |
| Bond | 0.50% |
| Convertible | 0.00% |
| Preferred | 0.00% |
| Other | 0.55% |
Top 10 Holdings
| Name | % Weight | Price | % Change |
|---|---|---|---|
| Innospec, Inc. | 3.50% | 83.44 | 0.74% |
| Franklin Electric Co., Inc. | 3.17% | 102.75 | 0.12% |
| UMB Financial Corp. | 3.16% | 133.21 | 1.05% |
| J&J Snack Foods Corp. | 2.92% | 78.49 | 1.99% |
| Avient Corp. | 2.29% | 35.55 | 0.28% |
| SouthState Bank Corp. | 2.28% | 96.95 | 1.35% |
| Hancock Whitney Corp. | 2.27% | 71.27 | 1.67% |
| Alamo Group, Inc. | 2.20% | 152.88 | -0.05% |
| Stewart Information Services Corp. | 2.11% | 67.26 | 1.74% |
| Douglas Dynamics, Inc. | 1.96% | 46.00 | -0.11% |
Fees & Availability
| Fees | |
| Actual 12B-1 Fee | -- |
| Actual Management Fee | 0.77% |
| Administration Fee | 126.0K% |
| Maximum Front Load | -- |
| Maximum Deferred Load | -- |
| Maximum Redemption Fee | -- |
| General Availability | |
| Available for Insurance Product | No |
| Available for RRSP | No |
| Purchase Details | |
| Open to New Investors |
|
| Minimum Initial Investment | 1.00M None |
| Minimum Subsequent Investment | 0.00 None |
Basic Info
| Investment Strategy | |
| The Fund seeks to produce growth of capital by investing primarily in common stocks of small U.S. companies. |
| General | |
| Security Type | Mutual Fund |
| Equity Style | Small Cap Value |
| Broad Asset Class | US Equity |
| Broad Category | Equity |
| Global Peer Group | Equity US Sm&Mid Cap |
| Peer Group | Small-Cap Value Funds |
| Global Macro | Equity North America |
| US Macro | Small-Cap Funds |
| YCharts Categorization | -- |
| YCharts Benchmark | -- |
| Prospectus Objective | Small-Cap Funds |
| Fund Owner Firm Name | Allspring |
| Broad Asset Class Benchmark Index | |
| ^SPXTR | 100.0% |
Fundamentals
| General | |
| Distribution Yield | -- |
| Dividend Yield TTM (6-8-26) | 0.73% |
| 30-Day SEC Yield | -- |
| 7-Day SEC Yield | -- |
| Number of Holdings | 112 |
| Stock | |
| Weighted Average PE Ratio | 24.51 |
| Weighted Average Price to Sales Ratio | 2.206 |
| Weighted Average Price to Book Ratio | 2.631 |
| Weighted Median ROE | 8.65% |
| Weighted Median ROA | 4.33% |
| ROI (TTM) | 7.10% |
| Return on Investment (TTM) | 7.10% |
| Earning Yield | 0.0568 |
| LT Debt / Shareholders Equity | 0.6276 |
| Number of Equity Holdings | 108 |
As of April 30, 2026
Growth Metrics
| EPS Growth (1Y) | 14.07% |
| EPS Growth (3Y) | -2.68% |
| EPS Growth (5Y) | 12.24% |
| Sales Growth (1Y) | 9.68% |
| Sales Growth (3Y) | 4.49% |
| Sales Growth (5Y) | 9.14% |
| Sales per Share Growth (1Y) | 6.27% |
| Sales per Share Growth (3Y) | 3.62% |
| Operating Cash Flow - Growth Rate (3Y) | 18.83% |
As of April 30, 2026
Fund Details
Top Portfolio Holders
| Name | % Weight |
|---|---|
| Portfolio A | 5.00% |
| Portfolio B | 3.50% |
| Portfolio C | 2.25% |
Excel Add-In Codes
| Name: =YCI("M:ESPIX", "name") |
| Broad Asset Class: =YCI("M:ESPIX", "broad_asset_class") |
| Broad Category: =YCI("M:ESPIX", "broad_category_group") |
| Prospectus Objective: =YCI("M:ESPIX", "prospectus_objective") |
| To find the codes for any of our securities and financial metrics, see our Complete Excel Reference. |