

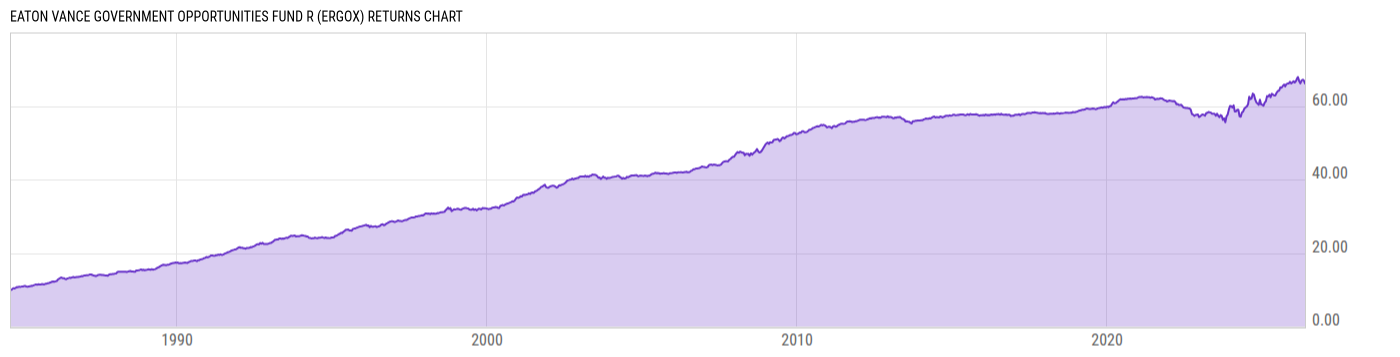
Eaton Vance Government Opportunities Fund R (ERGOX)
5.27
+0.01
(+0.19%)
USD |
Jun 09 2026
Returns Chart
Key Stats
| Net Expense Ratio | Total Assets Under Management | Weighted Average Dividend Yield | Turnover Ratio (Generic) |
|---|---|---|---|
| 3.01% | 428.75M | -- | 254.0% |
| 1 Year Fund Level Flows | 1 Year Total Returns (Daily) | Annualized Total Returns Since Inception (Daily) | Max Drawdown (Since Inception) |
| 44.39M | 5.48% |
Basic Info
| Investment Strategy | |
| The Fund seeks to provide a high current return. The Fund invests at least 80% of its net assets in securities issued, backed or otherwise guaranteed by the U.S. Government, or its agencies or instrumentalities. The Fund may invest in mortgage-backed securities. The Fund may engage in derivative transactions. |
| General | |
| Security Type | Mutual Fund |
| Equity Style | -- |
| Broad Asset Class | Taxable Bond |
| Broad Category | Fixed Income |
| Global Peer Group | Bond USD Medium Term |
| Peer Group | Short-Intermediate U.S. Government Funds |
| Global Macro | Bond HC |
| US Macro | Short-/Intermediate-Term U.S. Government & Treasury Funds |
| YCharts Categorization | -- |
| YCharts Benchmark | -- |
| Prospectus Objective | Short-Intermediate U.S. Government Funds |
| Fund Owner Firm Name | Eaton Vance |
| Broad Asset Class Benchmark Index | |
| ^BBUSATR | 100.0% |
Net Fund Flows Versus Peer Group
1 Month
% Rank:
25
-49.80M
Peer Group Low
5.786M
Peer Group High
1 Year
% Rank:
14
44.39M
-234.45M
Peer Group Low
54.25M
Peer Group High
3 Months
% Rank:
14
-47.68M
Peer Group Low
23.79M
Peer Group High
3 Years
% Rank:
49
-141.20M
Peer Group Low
150.05M
Peer Group High
6 Months
% Rank:
10
-24.82M
Peer Group Low
33.10M
Peer Group High
5 Years
% Rank:
29
-415.59M
Peer Group Low
170.13M
Peer Group High
YTD
% Rank:
10
-25.49M
Peer Group Low
24.81M
Peer Group High
10 Years
% Rank:
25
-518.93M
Peer Group Low
170.13M
Peer Group High
Date Unavailable
Risk
Performance Versus Peer Group
Annual Total Returns Versus Peers
As of June 10, 2026.
Asset Allocation
As of January 31, 2026.
| Type | % Net |
|---|---|
| Cash | -23.34% |
| Stock | 0.00% |
| Bond | 123.4% |
| Convertible | 0.00% |
| Preferred | 0.00% |
| Other | -0.02% |
Top 10 Holdings
| Name | % Weight | Price | % Change |
|---|---|---|---|
| FEDERAL NATIONAL MORTGAGE ASSOCIATION FNMA-New 5.5 02/15/2040 FIX USD Agency | 5.19% | -- | -- |
|
GOVERNMENT NATIONAL MORTGAGE ASSOCIATION 23165B EY SEQ FIX 6.5% 20-NOV-2053
|
4.87% | -- | -- |
| FEDERAL NATIONAL MORTGAGE ASSOCIATION FNMA-New 5.0 12/02/2045 FIX USD Agency | 4.34% | -- | -- |
|
Federal National Mortgage Association 3% 01-MAR-2056
|
4.32% | -- | -- |
|
Nomura Corporate Funding Americas LLC FRN 144A 01-Jan-2059
|
3.45% | -- | -- |
|
California Custom Processing LLC FRN 16-Feb-2043
|
2.79% | -- | -- |
|
GOVERNMENT NATIONAL MORTGAGE ASSOCIATION 23165H DY SEQ FIX 6% 20-NOV-2053
|
2.52% | -- | -- |
|
Federal National Mortgage Association 3% 01-FEB-2056
|
2.48% | -- | -- |
|
Reap Hidden Hollow FRN 16-Feb-2043
|
2.03% | -- | -- |
|
GOVERNMENT NATIONAL MORTGAGE ASSOCIATION 265H QS PAC INV 9.859575% 20-JAN-2056
|
2.02% | -- | -- |
Fees & Availability
| Fees | |
| Actual 12B-1 Fee | 0.50% |
| Actual Management Fee | 0.56% |
| Administration Fee | -- |
| Maximum Front Load | -- |
| Maximum Deferred Load | -- |
| Maximum Redemption Fee | -- |
| General Availability | |
| Available for Insurance Product | No |
| Available for RRSP | No |
| Purchase Details | |
| Open to New Investors |
|
| Minimum Initial Investment | 1000.00 None |
| Minimum Subsequent Investment | 0.00 None |
Basic Info
| Investment Strategy | |
| The Fund seeks to provide a high current return. The Fund invests at least 80% of its net assets in securities issued, backed or otherwise guaranteed by the U.S. Government, or its agencies or instrumentalities. The Fund may invest in mortgage-backed securities. The Fund may engage in derivative transactions. |
| General | |
| Security Type | Mutual Fund |
| Equity Style | -- |
| Broad Asset Class | Taxable Bond |
| Broad Category | Fixed Income |
| Global Peer Group | Bond USD Medium Term |
| Peer Group | Short-Intermediate U.S. Government Funds |
| Global Macro | Bond HC |
| US Macro | Short-/Intermediate-Term U.S. Government & Treasury Funds |
| YCharts Categorization | -- |
| YCharts Benchmark | -- |
| Prospectus Objective | Short-Intermediate U.S. Government Funds |
| Fund Owner Firm Name | Eaton Vance |
| Broad Asset Class Benchmark Index | |
| ^BBUSATR | 100.0% |
Fundamentals
| General | |
| Distribution Yield | -- |
| Dividend Yield TTM (6-8-26) | 5.27% |
| 30-Day SEC Yield (5-31-26) | 4.96% |
| 7-Day SEC Yield | -- |
| Number of Holdings | 456 |
| Bond | |
| Yield to Maturity (1-31-26) | 5.23% |
| Effective Duration | -- |
| Average Coupon | 5.83% |
| Calculated Average Quality | 1.020 |
| Effective Maturity | 27.29 |
| Nominal Maturity | 27.29 |
| Number of Bond Holdings | 439 |
As of January 31, 2026
Fund Details
Top Portfolio Holders
| Name | % Weight |
|---|---|
| Portfolio A | 5.00% |
| Portfolio B | 3.50% |
| Portfolio C | 2.25% |
Excel Add-In Codes
| Name: =YCI("M:ERGOX", "name") |
| Broad Asset Class: =YCI("M:ERGOX", "broad_asset_class") |
| Broad Category: =YCI("M:ERGOX", "broad_category_group") |
| Prospectus Objective: =YCI("M:ERGOX", "prospectus_objective") |
| To find the codes for any of our securities and financial metrics, see our Complete Excel Reference. |