

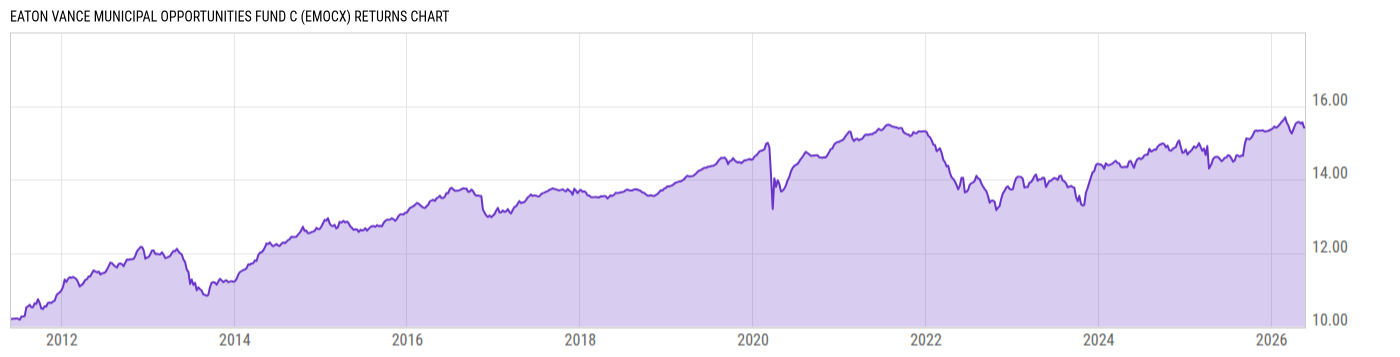
Eaton Vance Municipal Opportunities Fund C (EMOCX)
11.38
+0.01
(+0.09%)
USD |
May 22 2026
Returns Chart
Key Stats
| Net Expense Ratio | Total Assets Under Management | Weighted Average Dividend Yield | Turnover Ratio (Generic) |
|---|---|---|---|
| 1.67% | 748.81M | -- | 152.0% |
| 1 Year Fund Level Flows | 1 Year Total Returns (Daily) | Annualized Total Returns Since Inception (Daily) | Max Drawdown (Since Inception) |
| 8.395M | 6.42% |
Basic Info
| Investment Strategy | |
| The Fund seeks to maximize after-tax total return. Under normal market circumstances, the Fund invests at least 80% of its net assets in municipal obligations. The Fund may invest in municipals of any duration and credit quality, and may invest up to 50% of its net assets in below investment grade debt. |
| General | |
| Security Type | Mutual Fund |
| Equity Style | -- |
| Broad Asset Class | Municipal Bond |
| Broad Category | Fixed Income |
| Global Peer Group | Bond USD Municipal |
| Peer Group | General & Insured Municipal Debt Funds |
| Global Macro | Bond HC |
| US Macro | National Municipal Debt Funds |
| YCharts Categorization | -- |
| YCharts Benchmark | -- |
| Prospectus Objective | General & Insured Municipal Debt Funds |
| Fund Owner Firm Name | Eaton Vance |
| Broad Asset Class Benchmark Index | |
| ^BBMBTR | 100.0% |
Net Fund Flows Versus Peer Group
1 Month
% Rank:
17
-99.16M
Peer Group Low
809.96M
Peer Group High
1 Year
% Rank:
42
8.395M
-752.82M
Peer Group Low
6.079B
Peer Group High
3 Months
% Rank:
85
-397.00M
Peer Group Low
1.450B
Peer Group High
3 Years
% Rank:
34
-4.696B
Peer Group Low
16.26B
Peer Group High
6 Months
% Rank:
69
-636.26M
Peer Group Low
2.119B
Peer Group High
5 Years
% Rank:
77
-8.303B
Peer Group Low
33.26B
Peer Group High
YTD
% Rank:
81
-391.95M
Peer Group Low
1.826B
Peer Group High
10 Years
% Rank:
64
-7.392B
Peer Group Low
45.51B
Peer Group High
Date Unavailable
Risk
Performance Versus Peer Group
Annual Total Returns Versus Peers
As of May 24, 2026.
Asset Allocation
As of February 28, 2026.
| Type | % Net |
|---|---|
| Cash | 0.02% |
| Stock | 0.00% |
| Bond | 99.74% |
| Convertible | 0.00% |
| Preferred | -0.13% |
| Other | 0.37% |
Top 10 Holdings
| Name | % Weight | Price | % Change |
|---|---|---|---|
| CALIFORNIA CMNTY CHOICE FING AUTH CLEAN ENERGY PROJ REV CA 5.000 01/01/2055 | 1.08% | 101.83 | 0.11% |
| MAINE ST HSG AUTH MTG PUR ME 3.720 11/15/2050 | 1.07% | 100.00 | 0.00% |
| PUBLIC FIN AUTH WIS SOLID WASTE DISP REV WI 1.100 07/01/2029 | 0.87% | 99.75 | 0.03% |
| NEW YORK ST HSG FIN AGY REV NY 3.730 11/01/2055 | 0.86% | 100.00 | 0.00% |
| SOUTH CAROLINA JOBS-ECONOMIC DEV AUTH RESIDENTIAL DEV REV SC 5.000 12/01/2035 | 0.86% | 103.88 | 0.11% |
| MICHIGAN FIN AUTH REV MI 4.000 02/15/2047 | 0.75% | 88.00 | 0.27% |
| CALIFORNIA ST CA 5.000 11/01/2042 | 0.75% | 108.24 | 0.10% |
| CONNECTICUT ST HEALTH & EDL FACS AUTH REV CT 5.250 07/01/2053 | 0.74% | 104.44 | 0.11% |
| CHICAGO ILL BRD ED IL 5.500 12/01/2037 | 0.72% | 104.15 | 0.12% |
| CHICAGO ILL BRD ED IL 5.250 12/01/2039 | 0.72% | 96.47 | 0.18% |
Fees & Availability
| Fees | |
| Actual 12B-1 Fee | 1.00% |
| Actual Management Fee | 0.54% |
| Administration Fee | -- |
| Maximum Front Load | -- |
| Maximum Deferred Load | 1.00% |
| Maximum Redemption Fee | -- |
| General Availability | |
| Available for Insurance Product | No |
| Available for RRSP | No |
| Purchase Details | |
| Open to New Investors |
|
| Minimum Initial Investment | 1000.00 None |
| Minimum Subsequent Investment | 0.00 None |
Basic Info
| Investment Strategy | |
| The Fund seeks to maximize after-tax total return. Under normal market circumstances, the Fund invests at least 80% of its net assets in municipal obligations. The Fund may invest in municipals of any duration and credit quality, and may invest up to 50% of its net assets in below investment grade debt. |
| General | |
| Security Type | Mutual Fund |
| Equity Style | -- |
| Broad Asset Class | Municipal Bond |
| Broad Category | Fixed Income |
| Global Peer Group | Bond USD Municipal |
| Peer Group | General & Insured Municipal Debt Funds |
| Global Macro | Bond HC |
| US Macro | National Municipal Debt Funds |
| YCharts Categorization | -- |
| YCharts Benchmark | -- |
| Prospectus Objective | General & Insured Municipal Debt Funds |
| Fund Owner Firm Name | Eaton Vance |
| Broad Asset Class Benchmark Index | |
| ^BBMBTR | 100.0% |
Fundamentals
| General | |
| Distribution Yield | -- |
| Dividend Yield TTM (5-21-26) | 2.55% |
| 30-Day SEC Yield (4-30-26) | 2.49% |
| 7-Day SEC Yield | -- |
| Number of Holdings | 583 |
| Bond | |
| Yield to Maturity (2-28-26) | 3.66% |
| Effective Duration | 6.69 |
| Average Coupon | 4.57% |
| Calculated Average Quality | 2.658 |
| Effective Maturity | 12.57 |
| Nominal Maturity | 16.79 |
| Number of Bond Holdings | 573 |
As of February 28, 2026
Fund Details
Top Portfolio Holders
| Name | % Weight |
|---|---|
| Portfolio A | 5.00% |
| Portfolio B | 3.50% |
| Portfolio C | 2.25% |
Excel Add-In Codes
| Name: =YCI("M:EMOCX", "name") |
| Broad Asset Class: =YCI("M:EMOCX", "broad_asset_class") |
| Broad Category: =YCI("M:EMOCX", "broad_category_group") |
| Prospectus Objective: =YCI("M:EMOCX", "prospectus_objective") |
| To find the codes for any of our securities and financial metrics, see our Complete Excel Reference. |