

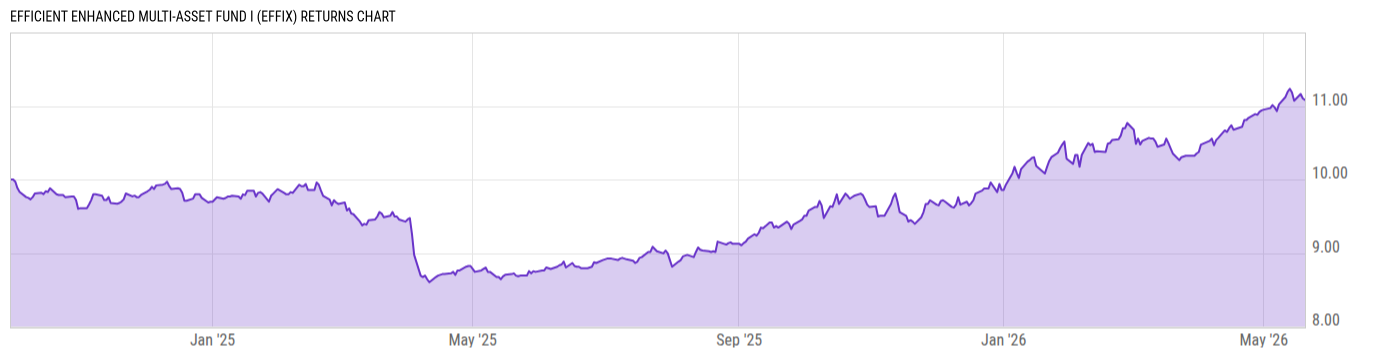
Efficient Enhanced Multi-Asset Fund I (EFFIX)
10.69
-0.05
(-0.47%)
USD |
Jun 09 2026
Returns Chart
Key Stats
| Net Expense Ratio | Total Assets Under Management | Weighted Average Dividend Yield | Turnover Ratio (Generic) |
|---|---|---|---|
| 2.00% | 87.53M | -- | 104.0% |
| 1 Year Fund Level Flows | 1 Year Total Returns (Daily) | Annualized Total Returns Since Inception (Daily) | Max Drawdown (Since Inception) |
| 4.966M | 22.65% |
Basic Info
| Investment Strategy | |
| The Fund seeks capital appreciation in both rising and falling equity markets. The Fund aims to achieve its objective by making investments in various asset classes combining two distinct yet complementary investment strategies: risk parity and trend following to achieve superior risk-adjusted returns and manage losses. |
| General | |
| Security Type | Mutual Fund |
| Equity Style | -- |
| Broad Asset Class | Alternative |
| Broad Category | Alternative Strategies |
| Global Peer Group | Alternative Multi Strategies |
| Peer Group | Alternative Multi-Strategy Funds |
| Global Macro | Liquid Alternatives |
| US Macro | Alternative Equity Funds |
| YCharts Categorization | -- |
| YCharts Benchmark | -- |
| Prospectus Objective | Alternative Multi-Strategy Funds |
| Fund Owner Firm Name | Efficient Capital Management |
| Broad Asset Class Benchmark Index | |
| ^MSACWINTR | 100.0% |
Net Fund Flows Versus Peer Group
1 Month
% Rank:
50
-140.05M
Peer Group Low
558.92M
Peer Group High
1 Year
% Rank:
44
4.966M
-552.08M
Peer Group Low
4.649B
Peer Group High
3 Months
% Rank:
55
-74.70M
Peer Group Low
1.340B
Peer Group High
3 Years
% Rank:
31
-1.663B
Peer Group Low
6.757B
Peer Group High
6 Months
% Rank:
48
-244.92M
Peer Group Low
2.749B
Peer Group High
5 Years
% Rank:
39
-2.277B
Peer Group Low
7.050B
Peer Group High
YTD
% Rank:
55
-195.06M
Peer Group Low
2.292B
Peer Group High
10 Years
% Rank:
47
-3.121B
Peer Group Low
7.072B
Peer Group High
Date Unavailable
Risk
Performance Versus Peer Group
Annual Total Returns Versus Peers
As of June 10, 2026.
Asset Allocation
As of November 30, 2025.
| Type | % Net |
|---|---|
| Cash | 35.52% |
| Stock | 0.00% |
| Bond | 62.84% |
| Convertible | 0.00% |
| Preferred | 0.00% |
| Other | 1.64% |
Top 10 Holdings
| Name | % Weight | Price | % Change |
|---|---|---|---|
| First American Government Obligations Fd X | 25.11% | 1.00 | 0.00% |
|
USD Cash
|
22.64% | -- | -- |
| United States of America USGB 06/02/2026 FIX USD Government (Matured) | 18.12% | 100.00 | 0.01% |
| United States of America USGB 05/28/2026 FIX USD Government (Matured) | 5.67% | 100.00 | 0.01% |
| United States of America USGB 0.0 07/02/2026 FIX USD Government | 5.65% | 99.78 | 0.01% |
| United States of America USGB 0.0 06/09/2026 FIX USD Government | 2.26% | 100.00 | 0.01% |
| United States of America USGB 1.875 07/15/2035 FIX USD Government | 1.65% | 98.12 | 0.20% |
| United States of America USGB 2.125 01/15/2035 FIX USD Government | 1.59% | 100.15 | 0.21% |
| United States of America USGB 1.875 07/15/2034 FIX USD Government | 1.46% | 98.92 | 0.17% |
| United States of America USGB 0.125 01/15/2032 FIX USD Government | 1.38% | 90.91 | 0.11% |
Fees & Availability
| Fees | |
| Actual 12B-1 Fee | -- |
| Actual Management Fee | 0.70% |
| Administration Fee | 122.0K% |
| Maximum Front Load | -- |
| Maximum Deferred Load | -- |
| Maximum Redemption Fee | -- |
| General Availability | |
| Available for Insurance Product | No |
| Available for RRSP | No |
| Purchase Details | |
| Open to New Investors |
|
| Minimum Initial Investment | 100000.0 None |
| Minimum Subsequent Investment | 500.00 None |
Basic Info
| Investment Strategy | |
| The Fund seeks capital appreciation in both rising and falling equity markets. The Fund aims to achieve its objective by making investments in various asset classes combining two distinct yet complementary investment strategies: risk parity and trend following to achieve superior risk-adjusted returns and manage losses. |
| General | |
| Security Type | Mutual Fund |
| Equity Style | -- |
| Broad Asset Class | Alternative |
| Broad Category | Alternative Strategies |
| Global Peer Group | Alternative Multi Strategies |
| Peer Group | Alternative Multi-Strategy Funds |
| Global Macro | Liquid Alternatives |
| US Macro | Alternative Equity Funds |
| YCharts Categorization | -- |
| YCharts Benchmark | -- |
| Prospectus Objective | Alternative Multi-Strategy Funds |
| Fund Owner Firm Name | Efficient Capital Management |
| Broad Asset Class Benchmark Index | |
| ^MSACWINTR | 100.0% |
Fundamentals
| General | |
| Distribution Yield | -- |
| Dividend Yield TTM (6-8-26) | 0.57% |
| 30-Day SEC Yield | -- |
| 7-Day SEC Yield | -- |
| Number of Holdings | 363 |
| Bond | |
| Yield to Maturity (11-30-25) | 3.02% |
| Effective Duration | -- |
| Average Coupon | 1.16% |
| Calculated Average Quality | 2.00 |
| Effective Maturity | 2.571 |
| Nominal Maturity | 2.571 |
| Number of Bond Holdings | 21 |
As of November 30, 2025
Fund Details
| Key Dates | |
| Inception Date | 9/30/2024 |
| Last Annual Report Date | 5/31/2025 |
| Last Prospectus Date | 9/29/2025 |
| Attributes | |
| Index Fund | -- |
| Inverse Fund | No |
| Leveraged Fund | -- |
| Fund of Funds | No |
| Currency Hedged Fund | -- |
| Socially Responsible Fund | No |
Top Portfolio Holders
| Name | % Weight |
|---|---|
| Portfolio A | 5.00% |
| Portfolio B | 3.50% |
| Portfolio C | 2.25% |
Excel Add-In Codes
| Name: =YCI("M:EFFIX", "name") |
| Broad Asset Class: =YCI("M:EFFIX", "broad_asset_class") |
| Broad Category: =YCI("M:EFFIX", "broad_category_group") |
| Prospectus Objective: =YCI("M:EFFIX", "prospectus_objective") |
| To find the codes for any of our securities and financial metrics, see our Complete Excel Reference. |