

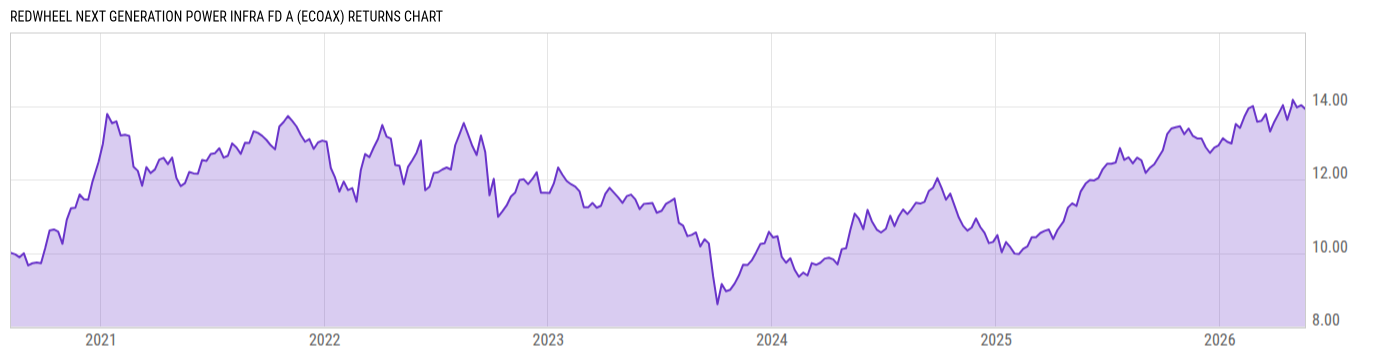
Redwheel Next Generation Power Infra Fd A (ECOAX)
11.22
+0.04
(+0.36%)
USD |
Jun 09 2026
Returns Chart
Key Stats
| Net Expense Ratio | Total Assets Under Management | Weighted Average Dividend Yield | Turnover Ratio (Generic) |
|---|---|---|---|
| 1.25% | 249.72M | 2.96% | 46.00% |
| 1 Year Fund Level Flows | 1 Year Total Returns (Daily) | Annualized Total Returns Since Inception (Daily) | Max Drawdown (Since Inception) |
| 22.15M | 15.92% |
Basic Info
| Investment Strategy | |
| The Fund seeks long-term total return derived principally from a combination of capital appreciation and income. The fund will invests in equity securities of companies who are developers, owners and operators, in full or in part, of renewable and low-emission power plants & systems, & related infrastructure investments. |
| General | |
| Security Type | Mutual Fund |
| Equity Style | Mid Cap Value |
| Broad Asset Class | Sector Equity |
| Broad Category | Equity |
| Global Peer Group | Equity Theme - Infrastructure |
| Peer Group | Global Infrastructure Funds |
| Global Macro | Equity Theme |
| US Macro | World Sector Equity Funds |
| YCharts Categorization | -- |
| YCharts Benchmark | -- |
| Prospectus Objective | Global Infrastructure Funds |
| Fund Owner Firm Name | Redwheel |
| Broad Asset Class Benchmark Index | |
| ^MSWNTR | 100.0% |
Net Fund Flows Versus Peer Group
1 Month
% Rank:
30
-20.30M
Peer Group Low
1.141B
Peer Group High
1 Year
% Rank:
45
22.15M
-139.90M
Peer Group Low
6.706B
Peer Group High
3 Months
% Rank:
23
-39.17M
Peer Group Low
2.281B
Peer Group High
3 Years
% Rank:
66
-720.62M
Peer Group Low
7.952B
Peer Group High
6 Months
% Rank:
43
-219.53M
Peer Group Low
4.639B
Peer Group High
5 Years
% Rank:
52
-917.85M
Peer Group Low
8.300B
Peer Group High
YTD
% Rank:
42
-112.57M
Peer Group Low
4.298B
Peer Group High
10 Years
% Rank:
21
-3.831B
Peer Group Low
8.615B
Peer Group High
Date Unavailable
Risk
Performance Versus Peer Group
Annual Total Returns Versus Peers
As of June 10, 2026.
Asset Allocation
As of April 30, 2026.
| Type | % Net |
|---|---|
| Cash | 2.00% |
| Stock | 93.13% |
| Bond | 0.00% |
| Convertible | 0.00% |
| Preferred | 0.00% |
| Other | 4.87% |
Top 10 Holdings
| Name | % Weight | Price | % Change |
|---|---|---|---|
| EDP Renewables SA | 6.28% | 16.96 | 0.00% |
| Clearway Energy, Inc. | 5.25% | 37.38 | -4.02% |
| ReNew Energy Global Plc | 5.12% | 6.055 | -1.38% |
| NextEra Energy, Inc. | 4.76% | 85.10 | 0.31% |
| BKW AG | 4.70% | 203.65 | 0.00% |
| Dominion Energy, Inc. | 4.68% | 66.76 | 0.77% |
|
ERG SpA ORD
|
4.23% | -- | -- |
| Constellation Energy Corp. | 4.22% | 242.26 | -3.73% |
| Enel SpA | 4.18% | 11.00 | -5.17% |
| Algonquin Power & Utilities Corp. | 3.99% | 5.90 | -0.67% |
Fees & Availability
| Fees | |
| Actual 12B-1 Fee | 0.25% |
| Actual Management Fee | 0.75% |
| Administration Fee | 820.0% |
| Maximum Front Load | 5.50% |
| Maximum Deferred Load | -- |
| Maximum Redemption Fee | -- |
| General Availability | |
| Available for Insurance Product | No |
| Available for RRSP | No |
| Purchase Details | |
| Open to New Investors |
|
| Minimum Initial Investment | 2500.00 None |
| Minimum Subsequent Investment | 100.00 None |
Basic Info
| Investment Strategy | |
| The Fund seeks long-term total return derived principally from a combination of capital appreciation and income. The fund will invests in equity securities of companies who are developers, owners and operators, in full or in part, of renewable and low-emission power plants & systems, & related infrastructure investments. |
| General | |
| Security Type | Mutual Fund |
| Equity Style | Mid Cap Value |
| Broad Asset Class | Sector Equity |
| Broad Category | Equity |
| Global Peer Group | Equity Theme - Infrastructure |
| Peer Group | Global Infrastructure Funds |
| Global Macro | Equity Theme |
| US Macro | World Sector Equity Funds |
| YCharts Categorization | -- |
| YCharts Benchmark | -- |
| Prospectus Objective | Global Infrastructure Funds |
| Fund Owner Firm Name | Redwheel |
| Broad Asset Class Benchmark Index | |
| ^MSWNTR | 100.0% |
Fundamentals
| General | |
| Distribution Yield | -- |
| Dividend Yield TTM (6-8-26) | 3.64% |
| 30-Day SEC Yield | -- |
| 7-Day SEC Yield | -- |
| Number of Holdings | 33 |
| Stock | |
| Weighted Average PE Ratio | 28.00 |
| Weighted Average Price to Sales Ratio | 3.141 |
| Weighted Average Price to Book Ratio | 2.179 |
| Weighted Median ROE | 6.72% |
| Weighted Median ROA | 2.01% |
| ROI (TTM) | 2.43% |
| Return on Investment (TTM) | 2.43% |
| Earning Yield | 0.0466 |
| LT Debt / Shareholders Equity | 1.319 |
| Number of Equity Holdings | 30 |
As of April 30, 2026
Growth Metrics
| EPS Growth (1Y) | 11.12% |
| EPS Growth (3Y) | 3.23% |
| EPS Growth (5Y) | 9.09% |
| Sales Growth (1Y) | 6.28% |
| Sales Growth (3Y) | 2.86% |
| Sales Growth (5Y) | 7.55% |
| Sales per Share Growth (1Y) | 0.40% |
| Sales per Share Growth (3Y) | 1.56% |
| Operating Cash Flow - Growth Rate (3Y) | 7.00% |
As of April 30, 2026
Fund Details
| Key Dates | |
| Inception Date | 9/25/2020 |
| Last Annual Report Date | 9/30/2025 |
| Last Prospectus Date | 3/31/2025 |
| Share Classes | |
| ECOIX | Inst |
| Attributes | |
| Index Fund | -- |
| Inverse Fund | No |
| Leveraged Fund | -- |
| Fund of Funds | No |
| Currency Hedged Fund | -- |
| Socially Responsible Fund | No |
Top Portfolio Holders
| Name | % Weight |
|---|---|
| Portfolio A | 5.00% |
| Portfolio B | 3.50% |
| Portfolio C | 2.25% |
Excel Add-In Codes
| Name: =YCI("M:ECOAX", "name") |
| Broad Asset Class: =YCI("M:ECOAX", "broad_asset_class") |
| Broad Category: =YCI("M:ECOAX", "broad_category_group") |
| Prospectus Objective: =YCI("M:ECOAX", "prospectus_objective") |
| To find the codes for any of our securities and financial metrics, see our Complete Excel Reference. |