

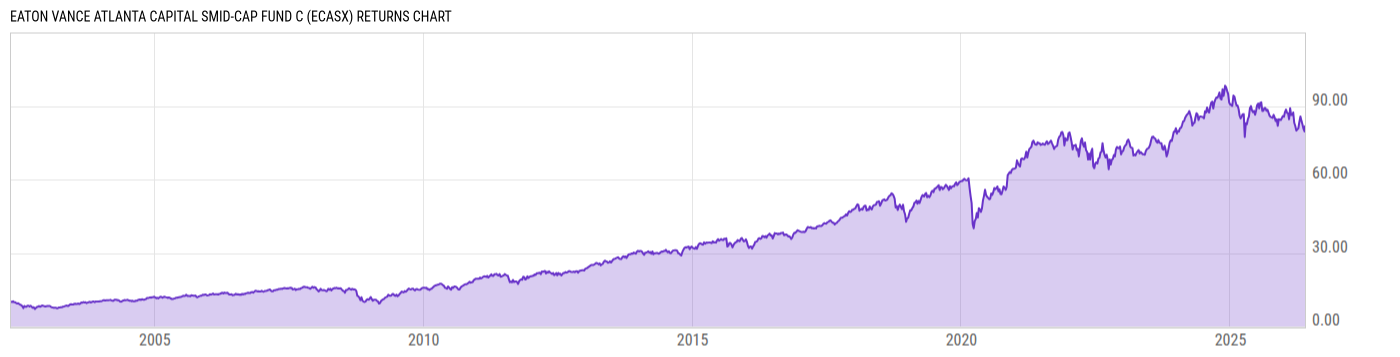
Eaton Vance Atlanta Capital SMID-Cap Fund C (ECASX)
23.21
+0.21
(+0.91%)
USD |
May 22 2026
Returns Chart
Key Stats
| Net Expense Ratio | Total Assets Under Management | Weighted Average Dividend Yield | Turnover Ratio (Generic) |
|---|---|---|---|
| 1.87% | 9.727B | 0.80% | 13.00% |
| 1 Year Fund Level Flows | 1 Year Total Returns (Daily) | Annualized Total Returns Since Inception (Daily) | Max Drawdown (Since Inception) |
| -4.027B | -6.93% |
Basic Info
| Investment Strategy | |
| The Fund seeks long-term capital growth. The Fund invests at least 80% of its net assets in small- to mid-cap stocks. The portfolio managers generally consider small- to mid-cap companies to be those companies having market capitalizations within the range of companies comprising the Russell 3000 Index. |
| General | |
| Security Type | Mutual Fund |
| Equity Style | Small Cap Core |
| Broad Asset Class | US Equity |
| Broad Category | Equity |
| Global Peer Group | Equity US Sm&Mid Cap |
| Peer Group | Mid-Cap Core Funds |
| Global Macro | Equity North America |
| US Macro | Mid-Cap Funds |
| YCharts Categorization | -- |
| YCharts Benchmark | -- |
| Prospectus Objective | Mid-Cap Funds |
| Fund Owner Firm Name | Eaton Vance |
| Broad Asset Class Benchmark Index | |
| ^SPXTR | 100.0% |
Net Fund Flows Versus Peer Group
1 Month
% Rank:
100
-510.90M
Peer Group Low
842.42M
Peer Group High
1 Year
% Rank:
99
-4.027B
-4.212B
Peer Group Low
4.000B
Peer Group High
3 Months
% Rank:
99
-2.099B
Peer Group Low
2.441B
Peer Group High
3 Years
% Rank:
93
-7.161B
Peer Group Low
8.440B
Peer Group High
6 Months
% Rank:
99
-2.839B
Peer Group Low
3.080B
Peer Group High
5 Years
% Rank:
94
-10.35B
Peer Group Low
13.49B
Peer Group High
YTD
% Rank:
99
-2.189B
Peer Group Low
2.085B
Peer Group High
10 Years
% Rank:
93
-16.89B
Peer Group Low
26.12B
Peer Group High
Date Unavailable
Risk
Performance Versus Peer Group
Annual Total Returns Versus Peers
As of May 25, 2026.
Asset Allocation
As of February 28, 2026.
| Type | % Net |
|---|---|
| Cash | 0.71% |
| Stock | 98.67% |
| Bond | 0.57% |
| Convertible | 0.00% |
| Preferred | 0.00% |
| Other | 0.05% |
Top 10 Holdings
| Name | % Weight | Price | % Change |
|---|---|---|---|
| Carlisle Cos., Inc. | 4.35% | 333.80 | 0.43% |
| CACI International, Inc. | 3.90% | 501.35 | 2.30% |
| Burlington Stores, Inc. | 3.62% | 324.51 | 2.68% |
| Casey's General Stores, Inc. | 3.24% | 825.02 | 0.03% |
| Avery Dennison Corp. | 3.06% | 159.66 | 0.48% |
| Aramark | 2.91% | 51.26 | -0.72% |
| Trimble, Inc. | 2.91% | 56.34 | 0.66% |
| AptarGroup, Inc. | 2.81% | 116.23 | 0.62% |
| W.R. Berkley Corp. | 2.80% | 67.54 | 0.10% |
| Markel Group, Inc. | 2.78% | 1857.89 | 0.24% |
Fees & Availability
| Fees | |
| Actual 12B-1 Fee | 1.00% |
| Actual Management Fee | 0.77% |
| Administration Fee | -- |
| Maximum Front Load | -- |
| Maximum Deferred Load | 1.00% |
| Maximum Redemption Fee | -- |
| General Availability | |
| Available for Insurance Product | No |
| Available for RRSP | No |
| Purchase Details | |
| Open to New Investors |
|
| Minimum Initial Investment | 1000.00 None |
| Minimum Subsequent Investment | 0.00 None |
Basic Info
| Investment Strategy | |
| The Fund seeks long-term capital growth. The Fund invests at least 80% of its net assets in small- to mid-cap stocks. The portfolio managers generally consider small- to mid-cap companies to be those companies having market capitalizations within the range of companies comprising the Russell 3000 Index. |
| General | |
| Security Type | Mutual Fund |
| Equity Style | Small Cap Core |
| Broad Asset Class | US Equity |
| Broad Category | Equity |
| Global Peer Group | Equity US Sm&Mid Cap |
| Peer Group | Mid-Cap Core Funds |
| Global Macro | Equity North America |
| US Macro | Mid-Cap Funds |
| YCharts Categorization | -- |
| YCharts Benchmark | -- |
| Prospectus Objective | Mid-Cap Funds |
| Fund Owner Firm Name | Eaton Vance |
| Broad Asset Class Benchmark Index | |
| ^SPXTR | 100.0% |
Fundamentals
| General | |
| Distribution Yield | -- |
| Dividend Yield TTM (5-21-26) | 0.00% |
| 30-Day SEC Yield (12-31-24) | 46.51M% |
| 7-Day SEC Yield | -- |
| Number of Holdings | 57 |
| Stock | |
| Weighted Average PE Ratio | 26.46 |
| Weighted Average Price to Sales Ratio | 2.977 |
| Weighted Average Price to Book Ratio | 6.499 |
| Weighted Median ROE | 37.22% |
| Weighted Median ROA | 8.66% |
| ROI (TTM) | 12.71% |
| Return on Investment (TTM) | 12.71% |
| Earning Yield | 0.0447 |
| LT Debt / Shareholders Equity | 1.659 |
| Number of Equity Holdings | 55 |
As of February 28, 2026
Growth Metrics
| EPS Growth (1Y) | 11.13% |
| EPS Growth (3Y) | 12.30% |
| EPS Growth (5Y) | 14.55% |
| Sales Growth (1Y) | 5.47% |
| Sales Growth (3Y) | 5.10% |
| Sales Growth (5Y) | 8.95% |
| Sales per Share Growth (1Y) | 8.11% |
| Sales per Share Growth (3Y) | 6.99% |
| Operating Cash Flow - Growth Rate (3Y) | 13.36% |
As of February 28, 2026
Fund Details
Top Portfolio Holders
| Name | % Weight |
|---|---|
| Portfolio A | 5.00% |
| Portfolio B | 3.50% |
| Portfolio C | 2.25% |
Excel Add-In Codes
| Name: =YCI("M:ECASX", "name") |
| Broad Asset Class: =YCI("M:ECASX", "broad_asset_class") |
| Broad Category: =YCI("M:ECASX", "broad_category_group") |
| Prospectus Objective: =YCI("M:ECASX", "prospectus_objective") |
| To find the codes for any of our securities and financial metrics, see our Complete Excel Reference. |