

Eaton Vance Short Duration Government Income Fd A (EALDX)
7.24
+0.01
(+0.14%)
USD |
Jun 09 2026
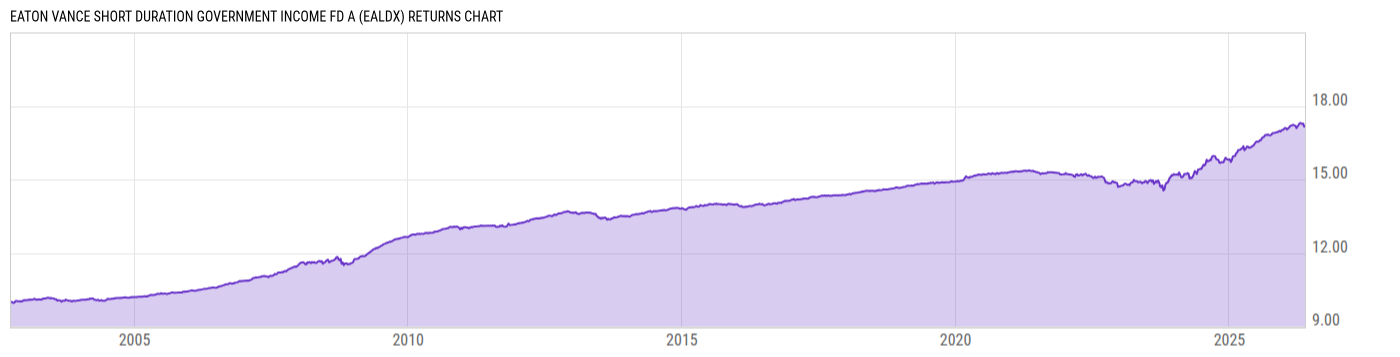
Returns Chart
Key Stats
| Net Expense Ratio | Total Assets Under Management | Weighted Average Dividend Yield | Turnover Ratio (Generic) |
|---|---|---|---|
| 0.89% | 3.158B | -- | 580.0% |
| 1 Year Fund Level Flows | 1 Year Total Returns (Daily) | Annualized Total Returns Since Inception (Daily) | Max Drawdown (Since Inception) |
| 334.63M | 5.35% |
Basic Info
| Investment Strategy | |
| The Fund seeks total return. The Fund invests at least 90% of its net assets in any securities issued, backed or otherwise guaranteed by the US Government or its agencies or instrumentalities, also the Fund may invest in securities in any ratings category considered to be of comparable quality by the investment adviser. |
| General | |
| Security Type | Mutual Fund |
| Equity Style | -- |
| Broad Asset Class | Taxable Bond |
| Broad Category | Fixed Income |
| Global Peer Group | Bond USD Government Short Term |
| Peer Group | Short U.S. Government Funds |
| Global Macro | Bond Short Term |
| US Macro | Short-/Intermediate-Term U.S. Government & Treasury Funds |
| YCharts Categorization | -- |
| YCharts Benchmark | -- |
| Prospectus Objective | Short U.S. Government Funds |
| Fund Owner Firm Name | Eaton Vance |
| Broad Asset Class Benchmark Index | |
| ^BBUSATR | 100.0% |
Net Fund Flows Versus Peer Group
1 Month
% Rank:
53
-5.624M
Peer Group Low
418.31M
Peer Group High
1 Year
% Rank:
9
334.63M
-79.26M
Peer Group Low
6.851B
Peer Group High
3 Months
% Rank:
42
-24.18M
Peer Group Low
1.527B
Peer Group High
3 Years
% Rank:
98
-1.491B
Peer Group Low
6.077B
Peer Group High
6 Months
% Rank:
40
-11.81M
Peer Group Low
4.157B
Peer Group High
5 Years
% Rank:
98
-8.027B
Peer Group Low
17.84B
Peer Group High
YTD
% Rank:
42
-26.13M
Peer Group Low
3.612B
Peer Group High
10 Years
% Rank:
40
-1.624B
Peer Group Low
32.65B
Peer Group High
Date Unavailable
Risk
Performance Versus Peer Group
Annual Total Returns Versus Peers
As of June 10, 2026.
Asset Allocation
As of January 31, 2026.
| Type | % Net |
|---|---|
| Cash | -0.21% |
| Stock | 0.00% |
| Bond | 99.22% |
| Convertible | 0.00% |
| Preferred | 0.00% |
| Other | 0.98% |
Top 10 Holdings
| Name | % Weight | Price | % Change |
|---|---|---|---|
| FEDERAL NATIONAL MORTGAGE ASSOCIATION FNMA-New 6.0 07/25/2036 FIX USD Agency | 13.88% | -- | -- |
| FEDERAL NATIONAL MORTGAGE ASSOCIATION FNMA-New 5.5 02/15/2040 FIX USD Agency | 10.77% | -- | -- |
|
Federal National Mortgage Association 3% 01-MAR-2056
|
4.23% | -- | -- |
|
Nomura Corporate Funding Americas LLC FRN 144A 01-Jan-2059
|
3.46% | -- | -- |
|
Government National Mortgage Association 2 5% 01-FEB-2056
|
3.37% | -- | -- |
| FNMA-New 02/01/2053 FIX USD Agency | 3.24% | -- | -- |
|
Federal National Mortgage Association 3% 01-FEB-2056
|
2.43% | -- | -- |
|
FEDERAL HOME LOAN MORTGAGE CORPORATION 5549L JF PT FLT 5.42419% 25-JUN-2055
|
2.34% | -- | -- |
|
GOVERNMENT NATIONAL MORTGAGE ASSOCIATION 22211A HF PT FLT 4.703% 20-DEC-2052
|
2.30% | -- | -- |
|
Government National Mortgage Association 2 20-DEC-2065 DN3890
|
1.91% | -- | -- |
Fees & Availability
| Fees | |
| Actual 12B-1 Fee | 0.25% |
| Actual Management Fee | 0.48% |
| Administration Fee | -- |
| Maximum Front Load | 2.25% |
| Maximum Deferred Load | -- |
| Maximum Redemption Fee | -- |
| General Availability | |
| Available for Insurance Product | No |
| Available for RRSP | No |
| Purchase Details | |
| Open to New Investors |
|
| Minimum Initial Investment | 1000.00 None |
| Minimum Subsequent Investment | 0.00 None |
Basic Info
| Investment Strategy | |
| The Fund seeks total return. The Fund invests at least 90% of its net assets in any securities issued, backed or otherwise guaranteed by the US Government or its agencies or instrumentalities, also the Fund may invest in securities in any ratings category considered to be of comparable quality by the investment adviser. |
| General | |
| Security Type | Mutual Fund |
| Equity Style | -- |
| Broad Asset Class | Taxable Bond |
| Broad Category | Fixed Income |
| Global Peer Group | Bond USD Government Short Term |
| Peer Group | Short U.S. Government Funds |
| Global Macro | Bond Short Term |
| US Macro | Short-/Intermediate-Term U.S. Government & Treasury Funds |
| YCharts Categorization | -- |
| YCharts Benchmark | -- |
| Prospectus Objective | Short U.S. Government Funds |
| Fund Owner Firm Name | Eaton Vance |
| Broad Asset Class Benchmark Index | |
| ^BBUSATR | 100.0% |
Fundamentals
| General | |
| Distribution Yield | -- |
| Dividend Yield TTM (6-8-26) | 5.44% |
| 30-Day SEC Yield (5-31-26) | 4.88% |
| 7-Day SEC Yield | -- |
| Number of Holdings | 818 |
| Bond | |
| Yield to Maturity (1-31-26) | 5.21% |
| Effective Duration | -- |
| Average Coupon | 5.72% |
| Calculated Average Quality | 1.00 |
| Effective Maturity | 29.06 |
| Nominal Maturity | 29.06 |
| Number of Bond Holdings | 793 |
As of January 31, 2026
Fund Details
Top Portfolio Holders
| Name | % Weight |
|---|---|
| Portfolio A | 5.00% |
| Portfolio B | 3.50% |
| Portfolio C | 2.25% |
Excel Add-In Codes
| Name: =YCI("M:EALDX", "name") |
| Broad Asset Class: =YCI("M:EALDX", "broad_asset_class") |
| Broad Category: =YCI("M:EALDX", "broad_category_group") |
| Prospectus Objective: =YCI("M:EALDX", "prospectus_objective") |
| To find the codes for any of our securities and financial metrics, see our Complete Excel Reference. |