

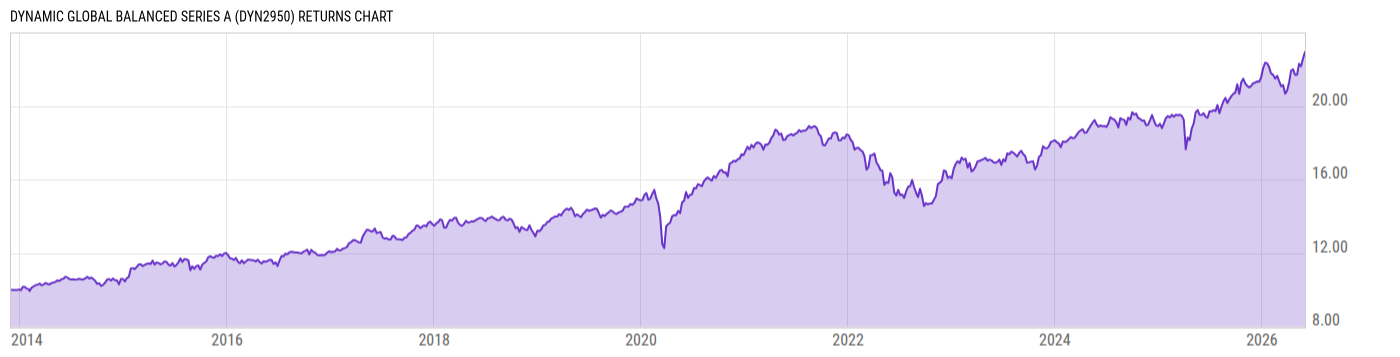
Dynamic Global Balanced Series A (DYN2950)
18.73
+0.01
(+0.08%)
CAD |
Jun 02 2026
Returns Chart
Key Stats
| Net Expense Ratio | Total Assets Under Management | Weighted Average Dividend Yield | Turnover Ratio (Generic) |
|---|---|---|---|
| 2.21% | 145.46M | 1.91% | 40.01% |
| 1 Year Fund Level Flows | 1 Year Total Returns (Daily) | Annualized Total Returns Since Inception (Daily) | Max Drawdown (Since Inception) |
| -20.40M | 17.57% |
Basic Info
| Investment Strategy | |
| Dynamic Global Balanced Fund seeks to achieve long-term capital growth and income through investing in equity securities and debt obligations of businesses located primarily outside of Canada by focusing, when selecting equity securities, on companies with strong business franchises. |
| General | |
| Security Type | Mutual Fund |
| Equity Style | Multi Cap Core |
| Broad Asset Class | International Equity |
| Broad Category | Allocation |
| Global Peer Group | Mixed Asset CAD Aggressive - Global |
| Peer Group | Global Equity Balanced |
| Global Macro | -- |
| US Macro | -- |
| YCharts Categorization | -- |
| YCharts Benchmark | -- |
| Prospectus Objective | -- |
| Fund Owner Firm Name | Dynamic Funds |
| Broad Asset Class Benchmark Index | |
| ^SPTSX60TR | 100.0% |
Net Fund Flows Versus Peer Group
1 Month
% Rank:
74
-53.58M
Peer Group Low
184.74M
Peer Group High
1 Year
% Rank:
75
-20.40M
-441.29M
Peer Group Low
2.428B
Peer Group High
3 Months
% Rank:
67
-125.77M
Peer Group Low
634.51M
Peer Group High
3 Years
% Rank:
73
-1.397B
Peer Group Low
6.627B
Peer Group High
6 Months
% Rank:
76
-294.20M
Peer Group Low
1.609B
Peer Group High
5 Years
% Rank:
69
-1.363B
Peer Group Low
6.779B
Peer Group High
YTD
% Rank:
71
-219.25M
Peer Group Low
1.159B
Peer Group High
10 Years
% Rank:
33
-1.321B
Peer Group Low
11.48B
Peer Group High
Date Unavailable
Risk
Performance Versus Peer Group
Annual Total Returns Versus Peers
As of June 03, 2026.
Asset Allocation
As of January 31, 2026.
| Type | % Net |
|---|---|
| Cash | 0.86% |
| Stock | 82.38% |
| Bond | 16.49% |
| Convertible | 0.00% |
| Preferred | 0.00% |
| Other | 0.26% |
Top 10 Holdings
| Name | % Weight | Price | % Change |
|---|---|---|---|
|
Dynamic Global Fixed Income Fund I
|
17.15% | -- | -- |
| Samsung Electronics Co., Ltd. | 4.58% | 140.00 | 0.00% |
|
Stora Enso Oyj ORD
|
3.72% | -- | -- |
| Techtronic Industries Co., Ltd. | 3.65% | 14.65 | 0.00% |
| Sampo Oyj | 3.52% | 10.25 | 0.00% |
| DSV A/S | 3.25% | 254.34 | 1.19% |
| NEC Corp. | 3.23% | 27.84 | -1.57% |
| Alphabet, Inc. | 3.21% | 361.85 | -3.86% |
| Eurofins Scientific SE | 3.06% | 68.80 | -2.78% |
| ITOCHU Corp. | 2.95% | 11.89 | -2.91% |
Fees & Availability
| Fees | |
| Actual 12B-1 Fee | -- |
| Actual Management Fee | -- |
| Administration Fee | -- |
| Maximum Front Load | -- |
| Maximum Deferred Load | -- |
| Maximum Redemption Fee | -- |
| General Availability | |
| Available for Insurance Product | No |
| Available for RRSP |
|
| Purchase Details | |
| Open to New Investors |
|
| Minimum Initial Investment | 500.00 None |
| Minimum Subsequent Investment | 100.00 None |
Basic Info
| Investment Strategy | |
| Dynamic Global Balanced Fund seeks to achieve long-term capital growth and income through investing in equity securities and debt obligations of businesses located primarily outside of Canada by focusing, when selecting equity securities, on companies with strong business franchises. |
| General | |
| Security Type | Mutual Fund |
| Equity Style | Multi Cap Core |
| Broad Asset Class | International Equity |
| Broad Category | Allocation |
| Global Peer Group | Mixed Asset CAD Aggressive - Global |
| Peer Group | Global Equity Balanced |
| Global Macro | -- |
| US Macro | -- |
| YCharts Categorization | -- |
| YCharts Benchmark | -- |
| Prospectus Objective | -- |
| Fund Owner Firm Name | Dynamic Funds |
| Broad Asset Class Benchmark Index | |
| ^SPTSX60TR | 100.0% |
Fundamentals
| General | |
| Distribution Yield | -- |
| Dividend Yield TTM (6-2-26) | 1.05% |
| 30-Day SEC Yield | -- |
| 7-Day SEC Yield | -- |
| Number of Holdings | 43 |
| Stock | |
| Weighted Average PE Ratio | 25.50 |
| Weighted Average Price to Sales Ratio | 3.981 |
| Weighted Average Price to Book Ratio | 4.865 |
| Weighted Median ROE | 21.04% |
| Weighted Median ROA | 8.09% |
| ROI (TTM) | 15.28% |
| Return on Investment (TTM) | 15.28% |
| Earning Yield | 0.0480 |
| LT Debt / Shareholders Equity | 0.5626 |
| Number of Equity Holdings | 36 |
| Bond | |
| Yield to Maturity (1-31-26) | 5.50% |
| Effective Duration | -- |
| Average Coupon | 5.93% |
| Calculated Average Quality | 3.169 |
| Effective Maturity | 15.23 |
| Nominal Maturity | 15.25 |
| Number of Bond Holdings | 0 |
As of January 31, 2026
Growth Metrics
| EPS Growth (1Y) | 22.51% |
| EPS Growth (3Y) | 7.89% |
| EPS Growth (5Y) | 11.10% |
| Sales Growth (1Y) | 7.23% |
| Sales Growth (3Y) | 7.51% |
| Sales Growth (5Y) | 10.18% |
| Sales per Share Growth (1Y) | 8.53% |
| Sales per Share Growth (3Y) | 8.97% |
| Operating Cash Flow - Growth Rate (3Y) | 5.04% |
As of January 31, 2026
Fund Details
| Key Dates | |
| Launch Date | 11/29/2013 |
| Last Annual Report Date | 6/30/2025 |
| Last Prospectus Date | -- |
| Share Classes | |
| DYN2953 | Fee-based Advice |
| DYN2958 | Institutional |
| DYN2959 | Commission-based Advice |
| DYN3819 | Fee-based Advice |
| Attributes | |
| Index Fund | -- |
| Inverse Fund | No |
| Leveraged Fund | -- |
| Fund of Funds | No |
| Currency Hedged Fund | -- |
| Socially Responsible Fund | No |
Top Portfolio Holders
| Name | % Weight |
|---|---|
| Portfolio A | 5.00% |
| Portfolio B | 3.50% |
| Portfolio C | 2.25% |
Excel Add-In Codes
| Name: =YCI("M:DYN2950", "name") |
| Broad Asset Class: =YCI("M:DYN2950", "broad_asset_class") |
| Broad Category: =YCI("M:DYN2950", "broad_category_group") |
| Prospectus Objective: =YCI("M:DYN2950", "prospectus_objective") |
| To find the codes for any of our securities and financial metrics, see our Complete Excel Reference. |