

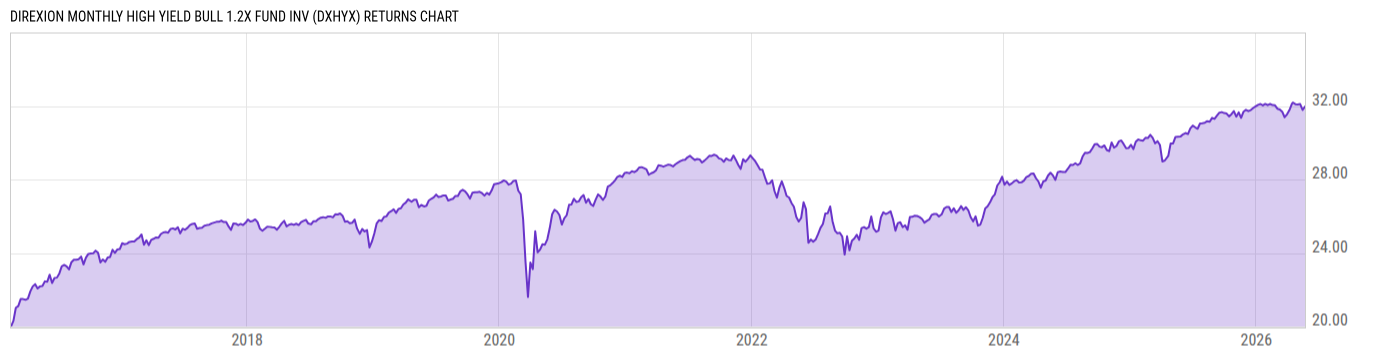
Direxion Monthly High Yield Bull 1.2X Fund Inv (DXHYX)
17.55
0.00 (0.00%)
USD |
May 22 2026
Returns Chart
Key Stats
| Net Expense Ratio | Total Assets Under Management | Weighted Average Dividend Yield | Turnover Ratio (Generic) |
|---|---|---|---|
| 1.70% | 7.816M | -- | 913.0% |
| 1 Year Fund Level Flows | 1 Year Total Returns (Daily) | Annualized Total Returns Since Inception (Daily) | Max Drawdown (Since Inception) |
| -2.712M | 6.08% |
Basic Info
| Investment Strategy | |
| The Fund seeks monthly investment results of 120% of the calendar month performance of the Solactive High Yield Beta Index. The Index provides exposure to three high yield ETFs: the SPDR Barclays High Yield Bond ETF, the iShares iBoxx $ High Yield Corporate Bond ETF and the PIMCO 0-5 Year High Yield Corporate Bond Index. |
| General | |
| Security Type | Mutual Fund |
| Equity Style | -- |
| Broad Asset Class | Taxable Bond |
| Broad Category | Fixed Income |
| Global Peer Group | Bond Other |
| Peer Group | Specialty Fixed Income Funds |
| Global Macro | Bond Other |
| US Macro | General Domestic Taxable Fixed Income Funds |
| YCharts Categorization | -- |
| YCharts Benchmark | -- |
| Prospectus Objective | Specialty Fixed Income Funds |
| Fund Owner Firm Name | Direxion |
| Broad Asset Class Benchmark Index | |
| ^BBUSATR | 100.0% |
Net Fund Flows Versus Peer Group
1 Month
% Rank:
68
-193.35M
Peer Group Low
147.05M
Peer Group High
1 Year
% Rank:
60
-2.712M
-1.778B
Peer Group Low
987.36M
Peer Group High
3 Months
% Rank:
69
-630.99M
Peer Group Low
255.94M
Peer Group High
3 Years
% Rank:
72
-486.13M
Peer Group Low
3.325B
Peer Group High
6 Months
% Rank:
33
-1.280B
Peer Group Low
429.29M
Peer Group High
5 Years
% Rank:
82
-1.672B
Peer Group Low
5.025B
Peer Group High
YTD
% Rank:
86
-1.044B
Peer Group Low
319.26M
Peer Group High
10 Years
% Rank:
83
-4.511B
Peer Group Low
5.125B
Peer Group High
Date Unavailable
Risk
Performance Versus Peer Group
Annual Total Returns Versus Peers
As of May 22, 2026.
Asset Allocation
As of February 28, 2026.
| Type | % Net |
|---|---|
| Cash | 17.91% |
| Stock | 0.01% |
| Bond | 49.54% |
| Convertible | 0.00% |
| Preferred | 0.00% |
| Other | 32.54% |
Top 7 Holdings
| Name | % Weight | Price | % Change |
|---|---|---|---|
|
OTHER ASSETS LESS LIABILITIES
|
32.29% | -- | -- |
| iShares iBoxx $ High Yield Corporate Bond ETF | 23.94% | 79.92 | 0.02% |
| State Street SPDR Bloomberg High Yield Bond ETF | 23.93% | 96.25 | 0.05% |
|
US BANK NA TIME/TERM DEPOSIT
|
13.60% | -- | -- |
| Invesco Government & Agency Portfolio Inst | 6.01% | 1.00 | 0.00% |
|
USD CASH
|
0.25% | -- | -- |
|
PIMCO 0-5 YEAR HIGH YIELD CORPORATE BOND INDEX ETF TRS
|
-0.01% | -- | -- |
Fees & Availability
| Fees | |
| Actual 12B-1 Fee | 0.25% |
| Actual Management Fee | 0.41% |
| Administration Fee | 12.86K% |
| Maximum Front Load | -- |
| Maximum Deferred Load | -- |
| Maximum Redemption Fee | -- |
| General Availability | |
| Available for Insurance Product | No |
| Available for RRSP | No |
| Purchase Details | |
| Open to New Investors |
|
| Minimum Initial Investment | 25000.00 None |
| Minimum Subsequent Investment | 500.00 None |
Basic Info
| Investment Strategy | |
| The Fund seeks monthly investment results of 120% of the calendar month performance of the Solactive High Yield Beta Index. The Index provides exposure to three high yield ETFs: the SPDR Barclays High Yield Bond ETF, the iShares iBoxx $ High Yield Corporate Bond ETF and the PIMCO 0-5 Year High Yield Corporate Bond Index. |
| General | |
| Security Type | Mutual Fund |
| Equity Style | -- |
| Broad Asset Class | Taxable Bond |
| Broad Category | Fixed Income |
| Global Peer Group | Bond Other |
| Peer Group | Specialty Fixed Income Funds |
| Global Macro | Bond Other |
| US Macro | General Domestic Taxable Fixed Income Funds |
| YCharts Categorization | -- |
| YCharts Benchmark | -- |
| Prospectus Objective | Specialty Fixed Income Funds |
| Fund Owner Firm Name | Direxion |
| Broad Asset Class Benchmark Index | |
| ^BBUSATR | 100.0% |
Fundamentals
| General | |
| Distribution Yield | -- |
| Dividend Yield TTM (5-21-26) | 3.60% |
| 30-Day SEC Yield (4-30-26) | 4.32% |
| 7-Day SEC Yield | -- |
| Number of Holdings | 7 |
Fund Details
| Key Dates | |
| Inception Date | 2/17/2016 |
| Last Annual Report Date | 8/31/2025 |
| Last Prospectus Date | 12/29/2025 |
| Attributes | |
| Index Fund | -- |
| Inverse Fund | No |
| Leveraged Fund |
|
| Fund of Funds |
|
| Currency Hedged Fund | -- |
| Socially Responsible Fund | No |
Top Portfolio Holders
| Name | % Weight |
|---|---|
| Portfolio A | 5.00% |
| Portfolio B | 3.50% |
| Portfolio C | 2.25% |
Excel Add-In Codes
| Name: =YCI("M:DXHYX", "name") |
| Broad Asset Class: =YCI("M:DXHYX", "broad_asset_class") |
| Broad Category: =YCI("M:DXHYX", "broad_category_group") |
| Prospectus Objective: =YCI("M:DXHYX", "prospectus_objective") |
| To find the codes for any of our securities and financial metrics, see our Complete Excel Reference. |