

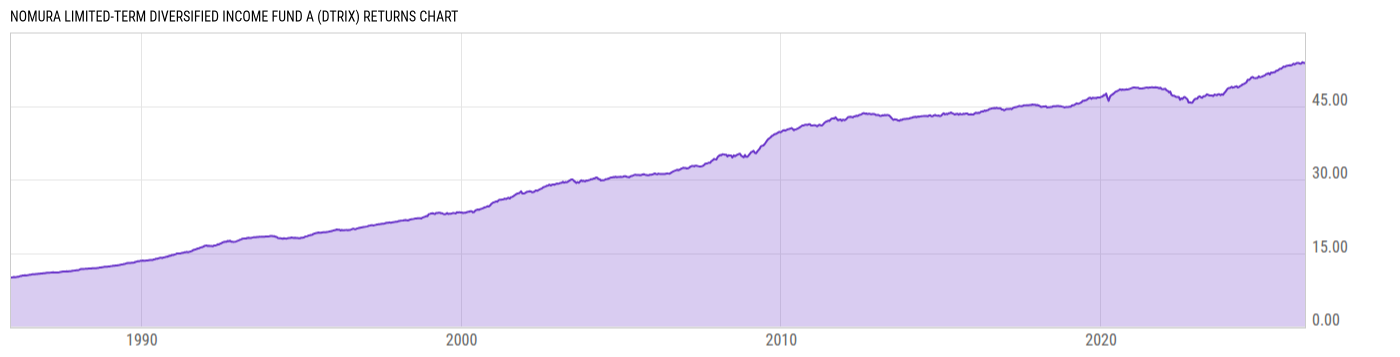
Nomura Limited-Term Diversified Income Fund A (DTRIX)
7.85
0.00 (0.00%)
USD |
Jun 08 2026
Returns Chart
Key Stats
| Net Expense Ratio | Total Assets Under Management | Weighted Average Dividend Yield | Turnover Ratio (Generic) |
|---|---|---|---|
| 0.65% | 606.79M | -- | 233.0% |
| 1 Year Fund Level Flows | 1 Year Total Returns (Daily) | Annualized Total Returns Since Inception (Daily) | Max Drawdown (Since Inception) |
| -121.40M | 3.75% |
Basic Info
| Investment Strategy | |
| The Fund seeks maximum total return, consistent with reasonable risk. Under normal circumstances, the Fund will invest at least 80% of its net assets in investment-grade fixed income securities. |
| General | |
| Security Type | Mutual Fund |
| Equity Style | -- |
| Broad Asset Class | Taxable Bond |
| Broad Category | Fixed Income |
| Global Peer Group | Bond USD Medium Term |
| Peer Group | Short-Intmdt Investment Grade Debt Funds |
| Global Macro | Bond HC |
| US Macro | Short/Intermediate Investment-Grade Funds |
| YCharts Categorization | -- |
| YCharts Benchmark | -- |
| Prospectus Objective | Short-Intmdt Investment Grade Debt Funds |
| Fund Owner Firm Name | Nomura Asset Management |
| Broad Asset Class Benchmark Index | |
| ^BBUSATR | 100.0% |
Net Fund Flows Versus Peer Group
1 Month
% Rank:
65
-110.70M
Peer Group Low
1.061B
Peer Group High
1 Year
% Rank:
85
-121.40M
-2.092B
Peer Group Low
8.621B
Peer Group High
3 Months
% Rank:
81
-523.74M
Peer Group Low
2.753B
Peer Group High
3 Years
% Rank:
70
-5.429B
Peer Group Low
5.912B
Peer Group High
6 Months
% Rank:
87
-1.373B
Peer Group Low
3.932B
Peer Group High
5 Years
% Rank:
51
-6.085B
Peer Group Low
6.014B
Peer Group High
YTD
% Rank:
87
-470.42M
Peer Group Low
3.804B
Peer Group High
10 Years
% Rank:
90
-3.652B
Peer Group Low
35.57B
Peer Group High
Date Unavailable
Risk
Performance Versus Peer Group
Annual Total Returns Versus Peers
As of June 09, 2026.
Asset Allocation
As of March 31, 2026.
| Type | % Net |
|---|---|
| Cash | 1.51% |
| Stock | 0.00% |
| Bond | 98.46% |
| Convertible | 0.00% |
| Preferred | 0.00% |
| Other | 0.02% |
Top 10 Holdings
| Name | % Weight | Price | % Change |
|---|---|---|---|
| United States of America USGB 3.5 01/15/2029 FIX USD Government | 13.52% | 98.35 | 0.09% |
| United States of America USGB 3.5 01/31/2028 FIX USD Government | 7.54% | 99.02 | 0.04% |
| United States of America USGB 3.625 12/31/2030 FIX USD Government | 5.83% | 97.41 | 0.15% |
| United States of America USGB 3.75 12/31/2028 FIX USD Government | 2.16% | 98.99 | 0.09% |
|
CASH AND CASH EQUIVALENTS
|
1.91% | -- | -- |
| United States of America USGB 3.75 01/31/2031 FIX USD Government | 1.80% | 97.90 | 0.16% |
|
PFS FINANCING CORP. 25A A SFTBMAT FLT 4.2898% 16-JAN-2029
|
1.65% | -- | -- |
| United States of America USGB 3.5 11/30/2030 FIX USD Government | 1.64% | 96.98 | 0.15% |
|
TOYOTA AUTO LOAN EXTENDED NOTE TRUST 221 A SEQ FIX 3.82% 25-APR-2035
|
1.30% | -- | -- |
| HONEYWELL AEROSPACE INC. HONEAER 4.0 03/16/2029 FIX USD Corporate 144A | 1.21% | 98.55 | 0.11% |
Fees & Availability
| Fees | |
| Actual 12B-1 Fee | 0.25% |
| Actual Management Fee | 0.19% |
| Administration Fee | -- |
| Maximum Front Load | 2.75% |
| Maximum Deferred Load | -- |
| Maximum Redemption Fee | -- |
| General Availability | |
| Available for Insurance Product | No |
| Available for RRSP | No |
| Purchase Details | |
| Open to New Investors |
|
| Minimum Initial Investment | 1000.00 None |
| Minimum Subsequent Investment | 100.00 None |
Basic Info
| Investment Strategy | |
| The Fund seeks maximum total return, consistent with reasonable risk. Under normal circumstances, the Fund will invest at least 80% of its net assets in investment-grade fixed income securities. |
| General | |
| Security Type | Mutual Fund |
| Equity Style | -- |
| Broad Asset Class | Taxable Bond |
| Broad Category | Fixed Income |
| Global Peer Group | Bond USD Medium Term |
| Peer Group | Short-Intmdt Investment Grade Debt Funds |
| Global Macro | Bond HC |
| US Macro | Short/Intermediate Investment-Grade Funds |
| YCharts Categorization | -- |
| YCharts Benchmark | -- |
| Prospectus Objective | Short-Intmdt Investment Grade Debt Funds |
| Fund Owner Firm Name | Nomura Asset Management |
| Broad Asset Class Benchmark Index | |
| ^BBUSATR | 100.0% |
Fundamentals
| General | |
| Distribution Yield | -- |
| Dividend Yield TTM (6-5-26) | 3.98% |
| 30-Day SEC Yield (4-30-26) | 3.93% |
| 7-Day SEC Yield | -- |
| Number of Holdings | 284 |
| Bond | |
| Yield to Maturity (3-31-26) | 4.68% |
| Effective Duration | 1.81 |
| Average Coupon | 4.63% |
| Calculated Average Quality | 2.693 |
| Effective Maturity | 4.745 |
| Nominal Maturity | 4.818 |
| Number of Bond Holdings | 263 |
As of March 31, 2026
Fund Details
Top Portfolio Holders
| Name | % Weight |
|---|---|
| Portfolio A | 5.00% |
| Portfolio B | 3.50% |
| Portfolio C | 2.25% |
Excel Add-In Codes
| Name: =YCI("M:DTRIX", "name") |
| Broad Asset Class: =YCI("M:DTRIX", "broad_asset_class") |
| Broad Category: =YCI("M:DTRIX", "broad_category_group") |
| Prospectus Objective: =YCI("M:DTRIX", "prospectus_objective") |
| To find the codes for any of our securities and financial metrics, see our Complete Excel Reference. |