

DFA Municipal Real Return Portfolio Institutional (DMREX)
10.82
0.00 (0.00%)
USD |
May 22 2026
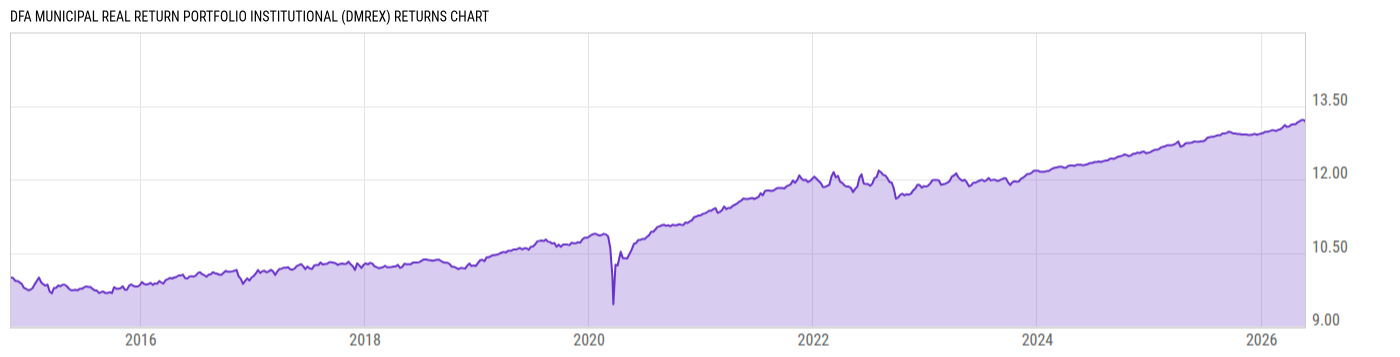
Returns Chart
Key Stats
| Net Expense Ratio | Total Assets Under Management | Weighted Average Dividend Yield | Turnover Ratio (Generic) |
|---|---|---|---|
| 0.24% | 1.808B | -- | 132.0% |
| 1 Year Fund Level Flows | 1 Year Total Returns (Daily) | Annualized Total Returns Since Inception (Daily) | Max Drawdown (Since Inception) |
| 28.49M | 3.32% |
Basic Info
| Investment Strategy | |
| The Fund seeks to provide inflation protection and to provide current income from municipal securities. The Fund invests primarily in a universe of investment grade municipal securities, including inflation-protected municipal securities, and in derivative instruments to provide inflation protection. |
| General | |
| Security Type | Mutual Fund |
| Equity Style | -- |
| Broad Asset Class | Municipal Bond |
| Broad Category | Fixed Income |
| Global Peer Group | Bond USD Municipal |
| Peer Group | General & Insured Municipal Debt Funds |
| Global Macro | Bond HC |
| US Macro | National Municipal Debt Funds |
| YCharts Categorization | -- |
| YCharts Benchmark | -- |
| Prospectus Objective | General & Insured Municipal Debt Funds |
| Fund Owner Firm Name | Dimensional |
| Broad Asset Class Benchmark Index | |
| ^BBMBTR | 100.0% |
Net Fund Flows Versus Peer Group
1 Month
% Rank:
72
-99.16M
Peer Group Low
809.96M
Peer Group High
1 Year
% Rank:
38
28.49M
-752.82M
Peer Group Low
6.079B
Peer Group High
3 Months
% Rank:
78
-397.00M
Peer Group Low
1.450B
Peer Group High
3 Years
% Rank:
56
-4.696B
Peer Group Low
16.26B
Peer Group High
6 Months
% Rank:
74
-636.26M
Peer Group Low
2.119B
Peer Group High
5 Years
% Rank:
21
-8.303B
Peer Group Low
33.26B
Peer Group High
YTD
% Rank:
75
-391.95M
Peer Group Low
1.826B
Peer Group High
10 Years
% Rank:
22
-7.392B
Peer Group Low
45.51B
Peer Group High
Date Unavailable
Risk
Performance Versus Peer Group
Annual Total Returns Versus Peers
As of May 25, 2026.
Asset Allocation
As of January 31, 2026.
| Type | % Net |
|---|---|
| Cash | -0.00% |
| Stock | 0.00% |
| Bond | 97.58% |
| Convertible | 0.00% |
| Preferred | 0.00% |
| Other | 2.42% |
Top 10 Holdings
| Name | % Weight | Price | % Change |
|---|---|---|---|
|
Inflation Swap General Security
|
4.07% | -- | -- |
| GWINNETT CNTY GA SCH DIST GA 5.000 08/01/2027 | 1.46% | 102.78 | -0.00% |
| DANBURY CONN CT 4.000 02/22/2027 | 1.12% | 100.94 | 0.00% |
| BROWARD CNTY FLA SCH DIST FL 4.000 06/25/2026 | 1.05% | 100.08 | -0.01% |
| LOUISVILLE & JEFFERSON CNTY KY METRO GOVT HEALTH SYS REV KY 1.950 10/01/2053 | 1.05% | 100.00 | 0.00% |
| HUDSON CNTY N J NJ 4.000 02/24/2027 | 1.01% | 100.93 | 0.00% |
| HAMPTON RDS VA TRANSN ACCOUNTABILITY COMMN REV VA 5.000 07/01/2026 | 0.97% | 100.23 | -0.02% |
| TRAVIS CNTY TEX TX 5.000 03/01/2028 | 0.95% | 103.84 | 0.01% |
| MASSACHUSETTS ST MA 5.000 12/01/2035 | 0.93% | 100.91 | -0.01% |
| WESTBOROUGH MASS MA 03/27/2026 (Matured) | 0.91% | -- | -- |
Fees & Availability
| Fees | |
| Actual 12B-1 Fee | -- |
| Actual Management Fee | 0.20% |
| Administration Fee | -- |
| Maximum Front Load | -- |
| Maximum Deferred Load | -- |
| Maximum Redemption Fee | -- |
| General Availability | |
| Available for Insurance Product | No |
| Available for RRSP | No |
| Purchase Details | |
| Open to New Investors |
|
| Minimum Initial Investment | 0.00 None |
| Minimum Subsequent Investment | 0.00 None |
Basic Info
| Investment Strategy | |
| The Fund seeks to provide inflation protection and to provide current income from municipal securities. The Fund invests primarily in a universe of investment grade municipal securities, including inflation-protected municipal securities, and in derivative instruments to provide inflation protection. |
| General | |
| Security Type | Mutual Fund |
| Equity Style | -- |
| Broad Asset Class | Municipal Bond |
| Broad Category | Fixed Income |
| Global Peer Group | Bond USD Municipal |
| Peer Group | General & Insured Municipal Debt Funds |
| Global Macro | Bond HC |
| US Macro | National Municipal Debt Funds |
| YCharts Categorization | -- |
| YCharts Benchmark | -- |
| Prospectus Objective | General & Insured Municipal Debt Funds |
| Fund Owner Firm Name | Dimensional |
| Broad Asset Class Benchmark Index | |
| ^BBMBTR | 100.0% |
Fundamentals
| General | |
| Distribution Yield | -- |
| Dividend Yield TTM (5-21-26) | 2.39% |
| 30-Day SEC Yield (4-30-26) | 2.29% |
| 7-Day SEC Yield | -- |
| Number of Holdings | 610 |
| Bond | |
| Yield to Maturity (1-31-26) | 2.04% |
| Effective Duration | 1.26 |
| Average Coupon | 4.77% |
| Calculated Average Quality | 1.580 |
| Effective Maturity | 1.772 |
| Nominal Maturity | 2.893 |
| Number of Bond Holdings | 592 |
As of January 31, 2026
Fund Details
| Key Dates | |
| Inception Date | 11/4/2014 |
| Last Annual Report Date | 10/31/2025 |
| Last Prospectus Date | 2/28/2025 |
| Attributes | |
| Index Fund | -- |
| Inverse Fund | No |
| Leveraged Fund | -- |
| Fund of Funds | No |
| Currency Hedged Fund | -- |
| Socially Responsible Fund | No |
Top Portfolio Holders
| Name | % Weight |
|---|---|
| Portfolio A | 5.00% |
| Portfolio B | 3.50% |
| Portfolio C | 2.25% |
Excel Add-In Codes
| Name: =YCI("M:DMREX", "name") |
| Broad Asset Class: =YCI("M:DMREX", "broad_asset_class") |
| Broad Category: =YCI("M:DMREX", "broad_category_group") |
| Prospectus Objective: =YCI("M:DMREX", "prospectus_objective") |
| To find the codes for any of our securities and financial metrics, see our Complete Excel Reference. |