

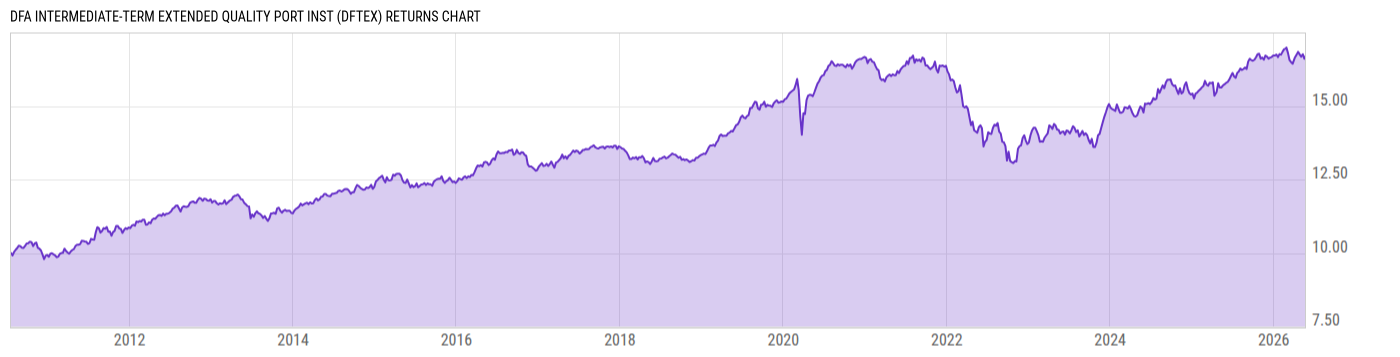
DFA Intermediate-Term Extended Quality Port Inst (DFTEX)
9.70
+0.03
(+0.31%)
USD |
Jun 09 2026
Returns Chart
Key Stats
| Net Expense Ratio | Total Assets Under Management | Weighted Average Dividend Yield | Turnover Ratio (Generic) |
|---|---|---|---|
| 0.20% | 1.818B | -- | 35.00% |
| 1 Year Fund Level Flows | 1 Year Total Returns (Daily) | Annualized Total Returns Since Inception (Daily) | Max Drawdown (Since Inception) |
| -111.18M | 6.22% |
Basic Info
| Investment Strategy | |
| The Fund seeks to maximize total returns. The Fund invests in a universe of U.S. and foreign corporate debt securities with an investment grade credit rating and that mature within three to fifteen years from the date of settlement and maintains an average dollar-weighted portfolio duration of between three and ten years. |
| General | |
| Security Type | Mutual Fund |
| Equity Style | -- |
| Broad Asset Class | Taxable Bond |
| Broad Category | Fixed Income |
| Global Peer Group | Bond Global Corporates USD |
| Peer Group | Corporate Debt Funds BBB-Rated |
| Global Macro | Bond Corporates |
| US Macro | General Domestic Taxable Fixed Income Funds |
| YCharts Categorization | -- |
| YCharts Benchmark | -- |
| Prospectus Objective | Corporate Debt Funds BBB-Rated |
| Fund Owner Firm Name | Dimensional |
| Broad Asset Class Benchmark Index | |
| ^BBUSATR | 100.0% |
Net Fund Flows Versus Peer Group
1 Month
% Rank:
69
-1.441B
Peer Group Low
748.99M
Peer Group High
1 Year
% Rank:
84
-111.18M
-3.244B
Peer Group Low
12.80B
Peer Group High
3 Months
% Rank:
67
-1.908B
Peer Group Low
1.681B
Peer Group High
3 Years
% Rank:
19
-9.856B
Peer Group Low
25.39B
Peer Group High
6 Months
% Rank:
20
-3.368B
Peer Group Low
8.887B
Peer Group High
5 Years
% Rank:
75
-10.18B
Peer Group Low
26.92B
Peer Group High
YTD
% Rank:
22
-471.58M
Peer Group Low
7.655B
Peer Group High
10 Years
% Rank:
41
-8.640B
Peer Group Low
62.93B
Peer Group High
Date Unavailable
Risk
Performance Versus Peer Group
Annual Total Returns Versus Peers
As of June 10, 2026.
Asset Allocation
As of February 28, 2026.
| Type | % Net |
|---|---|
| Cash | 0.43% |
| Stock | 0.00% |
| Bond | 98.26% |
| Convertible | 0.00% |
| Preferred | 0.00% |
| Other | 1.31% |
Top 10 Holdings
| Name | % Weight | Price | % Change |
|---|---|---|---|
|
DFA Investment Trust Company
|
3.54% | -- | -- |
|
New Zealand (Government) 4.5% 15-MAY-2030
|
2.71% | -- | -- |
|
International Development Association 2.5% 28-MAY-2030
|
1.76% | -- | -- |
|
Agence Francaise De Developpement 2.875% 21-JAN-2030
|
0.92% | -- | -- |
| Johnson & Johnson JNJ 4.95 06/01/2034 FIX USD Corporate | 0.85% | 102.37 | 0.17% |
| United States of America USGB 5.25 11/15/2028 FIX USD Government | 0.85% | 102.49 | 0.08% |
|
Lansforsakringar Bank AB 3.25% 22-JAN-2030
|
0.80% | -- | -- |
|
American Honda Finance Corp 3.3% 21-MAR-2029
|
0.80% | -- | -- |
|
NATWEST MARKETS PLC 3.125% 10-JAN-2030
|
0.77% | -- | -- |
|
Caisse d'Amortissement De La Dette Sociale 2.875% 25-MAY-2030
|
0.63% | -- | -- |
Fees & Availability
| Fees | |
| Actual 12B-1 Fee | -- |
| Actual Management Fee | 0.16% |
| Administration Fee | -- |
| Maximum Front Load | -- |
| Maximum Deferred Load | -- |
| Maximum Redemption Fee | -- |
| General Availability | |
| Available for Insurance Product | No |
| Available for RRSP | No |
| Purchase Details | |
| Open to New Investors |
|
| Minimum Initial Investment | 0.00 None |
| Minimum Subsequent Investment | 0.00 None |
Basic Info
| Investment Strategy | |
| The Fund seeks to maximize total returns. The Fund invests in a universe of U.S. and foreign corporate debt securities with an investment grade credit rating and that mature within three to fifteen years from the date of settlement and maintains an average dollar-weighted portfolio duration of between three and ten years. |
| General | |
| Security Type | Mutual Fund |
| Equity Style | -- |
| Broad Asset Class | Taxable Bond |
| Broad Category | Fixed Income |
| Global Peer Group | Bond Global Corporates USD |
| Peer Group | Corporate Debt Funds BBB-Rated |
| Global Macro | Bond Corporates |
| US Macro | General Domestic Taxable Fixed Income Funds |
| YCharts Categorization | -- |
| YCharts Benchmark | -- |
| Prospectus Objective | Corporate Debt Funds BBB-Rated |
| Fund Owner Firm Name | Dimensional |
| Broad Asset Class Benchmark Index | |
| ^BBUSATR | 100.0% |
Fundamentals
| General | |
| Distribution Yield | -- |
| Dividend Yield TTM (6-8-26) | 4.95% |
| 30-Day SEC Yield (4-30-26) | 4.65% |
| 7-Day SEC Yield | -- |
| Number of Holdings | 618 |
| Bond | |
| Yield to Maturity (2-28-26) | 4.38% |
| Effective Duration | 6.79 |
| Average Coupon | 4.38% |
| Calculated Average Quality | 3.144 |
| Effective Maturity | 8.906 |
| Nominal Maturity | 9.005 |
| Number of Bond Holdings | 611 |
As of February 28, 2026
Fund Details
| Key Dates | |
| Inception Date | 7/20/2010 |
| Last Annual Report Date | 10/31/2025 |
| Last Prospectus Date | 2/28/2026 |
| Attributes | |
| Index Fund | -- |
| Inverse Fund | No |
| Leveraged Fund | -- |
| Fund of Funds | No |
| Currency Hedged Fund | -- |
| Socially Responsible Fund | No |
Top Portfolio Holders
| Name | % Weight |
|---|---|
| Portfolio A | 5.00% |
| Portfolio B | 3.50% |
| Portfolio C | 2.25% |
Excel Add-In Codes
| Name: =YCI("M:DFTEX", "name") |
| Broad Asset Class: =YCI("M:DFTEX", "broad_asset_class") |
| Broad Category: =YCI("M:DFTEX", "broad_category_group") |
| Prospectus Objective: =YCI("M:DFTEX", "prospectus_objective") |
| To find the codes for any of our securities and financial metrics, see our Complete Excel Reference. |