

DFA International Real Estate Securities Port Inst (DFITX)
3.70
+0.04
(+1.09%)
USD |
Jun 09 2026
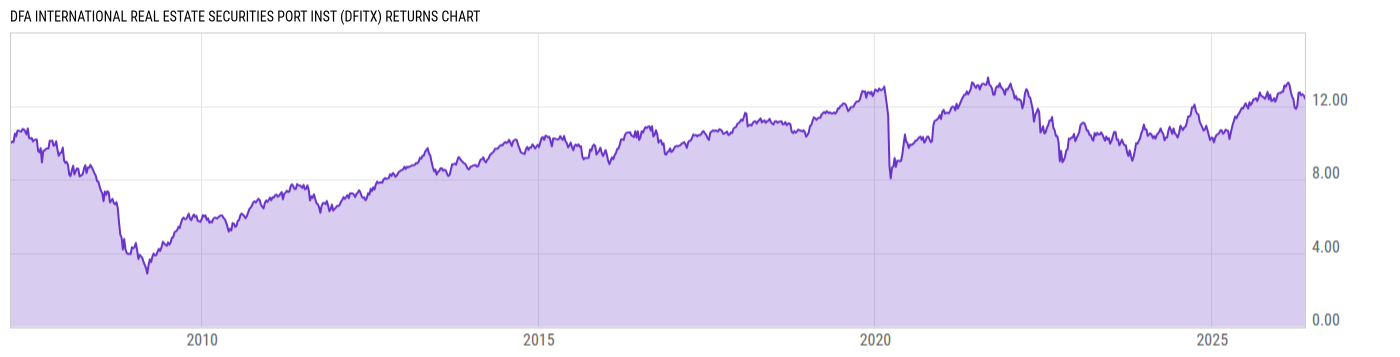
Returns Chart
Key Stats
| Net Expense Ratio | Total Assets Under Management | Weighted Average Dividend Yield | Turnover Ratio (Generic) |
|---|---|---|---|
| 0.28% | 3.161B | -- | 3.00% |
| 1 Year Fund Level Flows | 1 Year Total Returns (Daily) | Annualized Total Returns Since Inception (Daily) | Max Drawdown (Since Inception) |
| -309.97M | 4.33% |
Basic Info
| Investment Strategy | |
| The Fund seeks long-term capital appreciation by concentrating its investments in a broad and diverse set of securities of non-U.S. companies principally engaged in the real estate industry with a particular focus on non-U.S. REITs. |
| General | |
| Security Type | Mutual Fund |
| Equity Style | Mid Cap Value |
| Broad Asset Class | Sector Equity |
| Broad Category | Equity |
| Global Peer Group | Equity Sector Real Estate Global |
| Peer Group | International Real Estate Funds |
| Global Macro | Equity Real Estate |
| US Macro | World Sector Equity Funds |
| YCharts Categorization | -- |
| YCharts Benchmark | -- |
| Prospectus Objective | International Real Estate Funds |
| Fund Owner Firm Name | Dimensional |
| Broad Asset Class Benchmark Index | |
| ^MSWNTR | 100.0% |
Net Fund Flows Versus Peer Group
1 Month
% Rank:
100
-17.59M
Peer Group Low
10.56M
Peer Group High
1 Year
% Rank:
100
-309.97M
-309.97M
Peer Group Low
143.38M
Peer Group High
3 Months
% Rank:
85
-61.32M
Peer Group Low
59.55M
Peer Group High
3 Years
% Rank:
100
-1.892B
Peer Group Low
277.11M
Peer Group High
6 Months
% Rank:
100
-154.12M
Peer Group Low
101.46M
Peer Group High
5 Years
% Rank:
100
-2.018B
Peer Group Low
544.96M
Peer Group High
YTD
% Rank:
100
-73.70M
Peer Group Low
99.95M
Peer Group High
10 Years
% Rank:
95
-4.539B
Peer Group Low
939.99M
Peer Group High
Date Unavailable
Risk
Performance Versus Peer Group
Annual Total Returns Versus Peers
As of June 10, 2026.
Asset Allocation
As of February 28, 2026.
| Type | % Net |
|---|---|
| Cash | 1.39% |
| Stock | 97.80% |
| Bond | 0.00% |
| Convertible | 0.00% |
| Preferred | 0.00% |
| Other | 0.82% |
Top 10 Holdings
| Name | % Weight | Price | % Change |
|---|---|---|---|
| Goodman Group | 8.01% | 21.88 | 3.94% |
| Unibail-Rodamco-Westfield SE | 2.82% | 109.73 | 0.00% |
| SEGRO PLC | 2.82% | 9.64 | -3.70% |
| Scentre Group | 2.81% | 2.85 | 0.00% |
| Link Real Estate Investment Trust | 2.43% | 5.00 | 0.00% |
|
DFA Investment Trust Company
|
2.29% | -- | -- |
| CapitaLand Integrated Commercial Trust | 2.28% | 1.835 | 0.00% |
| Stockland | 1.75% | 2.46 | 0.00% |
| Klépierre SA | 1.65% | 40.04 | 0.00% |
| CapitaLand Ascendas REIT | 1.59% | 2.002 | 0.00% |
Fees & Availability
| Fees | |
| Actual 12B-1 Fee | -- |
| Actual Management Fee | 0.24% |
| Administration Fee | -- |
| Maximum Front Load | -- |
| Maximum Deferred Load | -- |
| Maximum Redemption Fee | -- |
| General Availability | |
| Available for Insurance Product | No |
| Available for RRSP | No |
| Purchase Details | |
| Open to New Investors |
|
| Minimum Initial Investment | 0.00 None |
| Minimum Subsequent Investment | 0.00 None |
Basic Info
| Investment Strategy | |
| The Fund seeks long-term capital appreciation by concentrating its investments in a broad and diverse set of securities of non-U.S. companies principally engaged in the real estate industry with a particular focus on non-U.S. REITs. |
| General | |
| Security Type | Mutual Fund |
| Equity Style | Mid Cap Value |
| Broad Asset Class | Sector Equity |
| Broad Category | Equity |
| Global Peer Group | Equity Sector Real Estate Global |
| Peer Group | International Real Estate Funds |
| Global Macro | Equity Real Estate |
| US Macro | World Sector Equity Funds |
| YCharts Categorization | -- |
| YCharts Benchmark | -- |
| Prospectus Objective | International Real Estate Funds |
| Fund Owner Firm Name | Dimensional |
| Broad Asset Class Benchmark Index | |
| ^MSWNTR | 100.0% |
Fundamentals
| General | |
| Distribution Yield | -- |
| Dividend Yield TTM (6-8-26) | 6.83% |
| 30-Day SEC Yield | -- |
| 7-Day SEC Yield | -- |
| Number of Holdings | 343 |
| Stock | |
| Weighted Average PE Ratio | 20.30 |
| Weighted Average Price to Sales Ratio | 10.61 |
| Weighted Average Price to Book Ratio | 1.244 |
| Weighted Median ROE | 6.69% |
| Weighted Median ROA | 3.88% |
| ROI (TTM) | 4.22% |
| Return on Investment (TTM) | 4.22% |
| Earning Yield | 0.0642 |
| LT Debt / Shareholders Equity | 587114.3 |
| Number of Equity Holdings | 321 |
As of February 28, 2026
Growth Metrics
| EPS Growth (1Y) | 37.98% |
| EPS Growth (3Y) | 1.52% |
| EPS Growth (5Y) | 2.17% |
| Sales Growth (1Y) | 7.65% |
| Sales Growth (3Y) | 8.17% |
| Sales Growth (5Y) | 8.31% |
| Sales per Share Growth (1Y) | 4.23% |
| Sales per Share Growth (3Y) | 4.63% |
| Operating Cash Flow - Growth Rate (3Y) | 6.48% |
As of February 28, 2026
Fund Details
| Key Dates | |
| Inception Date | 3/1/2007 |
| Last Annual Report Date | 10/31/2025 |
| Last Prospectus Date | 2/28/2026 |
| Attributes | |
| Index Fund | -- |
| Inverse Fund | No |
| Leveraged Fund | -- |
| Fund of Funds | No |
| Currency Hedged Fund | -- |
| Socially Responsible Fund | No |
Top Portfolio Holders
| Name | % Weight |
|---|---|
| Portfolio A | 5.00% |
| Portfolio B | 3.50% |
| Portfolio C | 2.25% |
Excel Add-In Codes
| Name: =YCI("M:DFITX", "name") |
| Broad Asset Class: =YCI("M:DFITX", "broad_asset_class") |
| Broad Category: =YCI("M:DFITX", "broad_category_group") |
| Prospectus Objective: =YCI("M:DFITX", "prospectus_objective") |
| To find the codes for any of our securities and financial metrics, see our Complete Excel Reference. |