

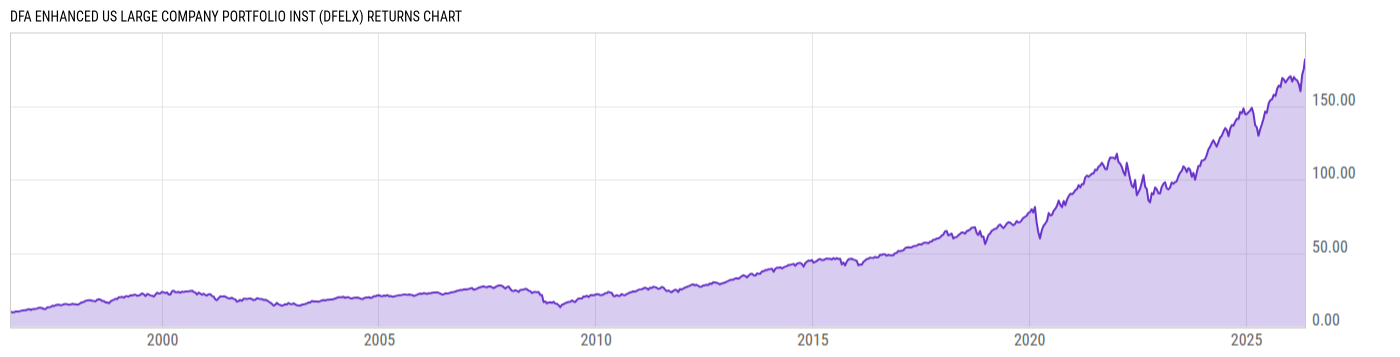
DFA Enhanced US Large Company Portfolio Inst (DFELX)
16.34
+0.04
(+0.25%)
USD |
May 29 2026
Returns Chart
Key Stats
| Net Expense Ratio | Total Assets Under Management | Weighted Average Dividend Yield | Turnover Ratio (Generic) |
|---|---|---|---|
| 0.15% | 224.74M | -- | 86.00% |
| 1 Year Fund Level Flows | 1 Year Total Returns (Daily) | Annualized Total Returns Since Inception (Daily) | Max Drawdown (Since Inception) |
| -52.78M | 29.65% |
Basic Info
| Investment Strategy | |
| The Fund seeks to achieve a total return which exceeds the total return performance of the S&P 500 Index. |
| General | |
| Security Type | Mutual Fund |
| Equity Style | -- |
| Broad Asset Class | US Equity |
| Broad Category | Equity |
| Global Peer Group | Equity US |
| Peer Group | Large-Cap Core Funds |
| Global Macro | Equity North America |
| US Macro | Large-Cap Funds |
| YCharts Categorization | -- |
| YCharts Benchmark | -- |
| Prospectus Objective | Growth & Income Funds |
| Fund Owner Firm Name | Dimensional |
| Broad Asset Class Benchmark Index | |
| ^SPXTR | 100.0% |
Net Fund Flows Versus Peer Group
1 Month
% Rank:
49
-5.233B
Peer Group Low
1.054B
Peer Group High
1 Year
% Rank:
50
-52.78M
-16.32B
Peer Group Low
12.11B
Peer Group High
3 Months
% Rank:
53
-9.978B
Peer Group Low
6.056B
Peer Group High
3 Years
% Rank:
52
-30.69B
Peer Group Low
26.39B
Peer Group High
6 Months
% Rank:
52
-12.73B
Peer Group Low
6.056B
Peer Group High
5 Years
% Rank:
56
-56.53B
Peer Group Low
26.35B
Peer Group High
YTD
% Rank:
49
-10.61B
Peer Group Low
6.056B
Peer Group High
10 Years
% Rank:
55
-136.53B
Peer Group Low
26.42B
Peer Group High
Date Unavailable
Risk
Performance Versus Peer Group
Annual Total Returns Versus Peers
As of May 30, 2026.
Asset Allocation
As of February 28, 2026.
| Type | % Net |
|---|---|
| Cash | 18.30% |
| Stock | 0.00% |
| Bond | 81.36% |
| Convertible | 0.00% |
| Preferred | 0.00% |
| Other | 0.33% |
Top 10 Holdings
| Name | % Weight | Price | % Change |
|---|---|---|---|
|
EMINI S&P JUN26
|
85.82% | -- | -- |
|
EMINI S&P MAR26
|
14.22% | -- | -- |
| United States of America USGB 05/26/2026 FIX USD Government (Matured) | 3.26% | 100.00 | 0.01% |
|
New Zealand Local Government Funding Agency Ltd 2.25% 15-MAY-2028
|
3.03% | -- | -- |
| United States of America USGB 05/14/2026 FIX USD Government (Matured) | 3.03% | 100.00 | 0.01% |
|
New Zealand (Government) .25% 15-MAY-2028
|
2.78% | -- | -- |
| United States of America USGB 03/24/2026 FIX USD Government (Matured) | 2.57% | -- | -- |
| United States of America USGB 0.0 06/23/2026 FIX USD Government | 2.48% | 99.78 | -0.03% |
|
United Overseas Bank Ltd (Sydney Branch) 4.4471% 16-APR-2027
|
2.01% | -- | -- |
| United States of America USGB 03/10/2026 FIX USD Government (Matured) | 1.99% | 100.00 | 0.36% |
Fees & Availability
| Fees | |
| Actual 12B-1 Fee | -- |
| Actual Management Fee | 0.09% |
| Administration Fee | -- |
| Maximum Front Load | -- |
| Maximum Deferred Load | -- |
| Maximum Redemption Fee | -- |
| General Availability | |
| Available for Insurance Product | No |
| Available for RRSP | No |
| Purchase Details | |
| Open to New Investors |
|
| Minimum Initial Investment | 0.00 None |
| Minimum Subsequent Investment | 0.00 None |
Basic Info
| Investment Strategy | |
| The Fund seeks to achieve a total return which exceeds the total return performance of the S&P 500 Index. |
| General | |
| Security Type | Mutual Fund |
| Equity Style | -- |
| Broad Asset Class | US Equity |
| Broad Category | Equity |
| Global Peer Group | Equity US |
| Peer Group | Large-Cap Core Funds |
| Global Macro | Equity North America |
| US Macro | Large-Cap Funds |
| YCharts Categorization | -- |
| YCharts Benchmark | -- |
| Prospectus Objective | Growth & Income Funds |
| Fund Owner Firm Name | Dimensional |
| Broad Asset Class Benchmark Index | |
| ^SPXTR | 100.0% |
Fundamentals
| General | |
| Distribution Yield | -- |
| Dividend Yield TTM (5-28-26) | 4.52% |
| 30-Day SEC Yield | -- |
| 7-Day SEC Yield | -- |
| Number of Holdings | 177 |
| Bond | |
| Yield to Maturity (2-28-26) | -- |
| Effective Duration | -- |
| Average Coupon | -- |
| Calculated Average Quality | -- |
| Effective Maturity | -- |
| Nominal Maturity | -- |
| Number of Bond Holdings | 130 |
As of February 28, 2026
Fund Details
| Key Dates | |
| Inception Date | 7/3/1996 |
| Last Annual Report Date | 10/31/2025 |
| Last Prospectus Date | 2/28/2025 |
| Attributes | |
| Index Fund | -- |
| Inverse Fund | No |
| Leveraged Fund | -- |
| Fund of Funds | No |
| Currency Hedged Fund | -- |
| Socially Responsible Fund | No |
Top Portfolio Holders
| Name | % Weight |
|---|---|
| Portfolio A | 5.00% |
| Portfolio B | 3.50% |
| Portfolio C | 2.25% |
Excel Add-In Codes
| Name: =YCI("M:DFELX", "name") |
| Broad Asset Class: =YCI("M:DFELX", "broad_asset_class") |
| Broad Category: =YCI("M:DFELX", "broad_category_group") |
| Prospectus Objective: =YCI("M:DFELX", "prospectus_objective") |
| To find the codes for any of our securities and financial metrics, see our Complete Excel Reference. |