

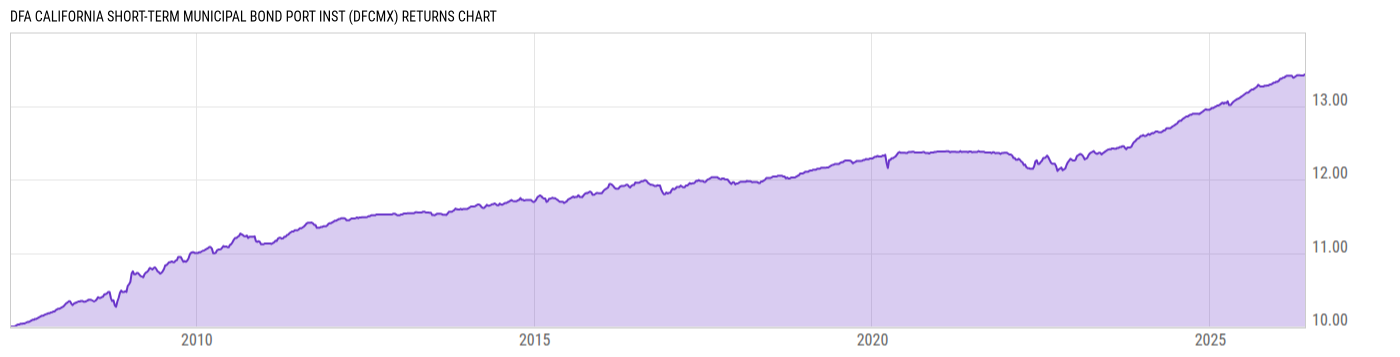
DFA California Short-Term Municipal Bond Port Inst (DFCMX)
10.22
0.00 (0.00%)
USD |
May 27 2026
Returns Chart
Key Stats
| Net Expense Ratio | Total Assets Under Management | Weighted Average Dividend Yield | Turnover Ratio (Generic) |
|---|---|---|---|
| 0.19% | 904.41M | -- | 153.0% |
| 1 Year Fund Level Flows | 1 Year Total Returns (Daily) | Annualized Total Returns Since Inception (Daily) | Max Drawdown (Since Inception) |
| 126.03M | 2.54% |
Basic Info
| Investment Strategy | |
| The Fund seeks to provide current income that is expected to be exempt from federal personal income taxes and California state personal income taxes. The Portfolio will have an average dollar-weighted portfolio maturity of three years or less. |
| General | |
| Security Type | Mutual Fund |
| Equity Style | -- |
| Broad Asset Class | Municipal Bond |
| Broad Category | Fixed Income |
| Global Peer Group | Bond USD Municipal Medium Term |
| Peer Group | California Sh-Intmdt Municipal Debt Fds |
| Global Macro | -- |
| US Macro | Single State Municipal Debt Funds |
| YCharts Categorization | -- |
| YCharts Benchmark | -- |
| Prospectus Objective | California Sh-Intmdt Municipal Debt Fds |
| Fund Owner Firm Name | Dimensional |
| Broad Asset Class Benchmark Index | |
| ^BBMBTR | 100.0% |
Net Fund Flows Versus Peer Group
1 Month
% Rank:
59
-3.216M
Peer Group Low
10.73M
Peer Group High
1 Year
% Rank:
6
126.03M
17.35M
Peer Group Low
126.03M
Peer Group High
3 Months
% Rank:
77
-4.447M
Peer Group Low
40.27M
Peer Group High
3 Years
% Rank:
89
-127.48M
Peer Group Low
142.05M
Peer Group High
6 Months
% Rank:
30
-4.493M
Peer Group Low
58.76M
Peer Group High
5 Years
% Rank:
59
-203.59M
Peer Group Low
176.66M
Peer Group High
YTD
% Rank:
30
-9.054M
Peer Group Low
53.85M
Peer Group High
10 Years
% Rank:
59
-499.89M
Peer Group Low
344.71M
Peer Group High
Date Unavailable
Risk
Performance Versus Peer Group
Annual Total Returns Versus Peers
As of May 28, 2026.
Asset Allocation
As of February 28, 2026.
| Type | % Net |
|---|---|
| Cash | 0.19% |
| Stock | 0.00% |
| Bond | 99.83% |
| Convertible | 0.00% |
| Preferred | 0.00% |
| Other | -0.02% |
Top 10 Holdings
| Name | % Weight | Price | % Change |
|---|---|---|---|
| LOS ANGELES CNTY CALIF CA 5.000 06/30/2026 | 2.42% | 100.20 | -0.00% |
| RIVERSIDE CNTY CALIF CA 5.000 06/30/2026 | 1.83% | 100.20 | -0.00% |
| SAN DIEGO CNTY CALIF CA 5.000 06/30/2026 | 1.77% | 100.21 | -0.00% |
| SAN DIEGO CNTY & SCH DIST NT PARTNS CALIF CA 5.000 08/31/2026 | 1.72% | 100.66 | -0.00% |
| LOS ANGELES CALIF CA 5.000 06/25/2026 | 1.62% | 100.21 | -0.01% |
| BERKELEY CALIF CA 4.000 07/28/2026 | 1.59% | 100.26 | -0.00% |
|
California Statewide Communities Development Authority 2.48% 05-MAY-2026
|
1.47% | -- | -- |
| CALIFORNIA ST CA 5.000 03/01/2027 | 1.29% | 101.91 | 0.01% |
| PAJARO VALLEY CALIF UNI SCH DIST CA 5.000 08/01/2026 | 1.26% | 100.43 | -0.00% |
| SAN DIEGO CALIF UNI SCH DIST CA 5.000 07/01/2026 | 1.26% | 100.23 | -0.00% |
Fees & Availability
| Fees | |
| Actual 12B-1 Fee | -- |
| Actual Management Fee | 0.14% |
| Administration Fee | 208.0K% |
| Maximum Front Load | -- |
| Maximum Deferred Load | -- |
| Maximum Redemption Fee | -- |
| General Availability | |
| Available for Insurance Product | No |
| Available for RRSP | No |
| Purchase Details | |
| Open to New Investors |
|
| Minimum Initial Investment | 0.00 None |
| Minimum Subsequent Investment | 0.00 None |
Basic Info
| Investment Strategy | |
| The Fund seeks to provide current income that is expected to be exempt from federal personal income taxes and California state personal income taxes. The Portfolio will have an average dollar-weighted portfolio maturity of three years or less. |
| General | |
| Security Type | Mutual Fund |
| Equity Style | -- |
| Broad Asset Class | Municipal Bond |
| Broad Category | Fixed Income |
| Global Peer Group | Bond USD Municipal Medium Term |
| Peer Group | California Sh-Intmdt Municipal Debt Fds |
| Global Macro | -- |
| US Macro | Single State Municipal Debt Funds |
| YCharts Categorization | -- |
| YCharts Benchmark | -- |
| Prospectus Objective | California Sh-Intmdt Municipal Debt Fds |
| Fund Owner Firm Name | Dimensional |
| Broad Asset Class Benchmark Index | |
| ^BBMBTR | 100.0% |
Fundamentals
| General | |
| Distribution Yield | -- |
| Dividend Yield TTM (5-26-26) | 2.51% |
| 30-Day SEC Yield (4-30-26) | 2.31% |
| 7-Day SEC Yield | -- |
| Number of Holdings | 360 |
| Bond | |
| Yield to Maturity (2-28-26) | 1.77% |
| Effective Duration | 0.80 |
| Average Coupon | 4.81% |
| Calculated Average Quality | 2.016 |
| Effective Maturity | 1.141 |
| Nominal Maturity | 2.474 |
| Number of Bond Holdings | 348 |
As of February 28, 2026
Fund Details
| Key Dates | |
| Inception Date | 4/2/2007 |
| Last Annual Report Date | 10/31/2025 |
| Last Prospectus Date | 2/28/2025 |
| Attributes | |
| Index Fund | -- |
| Inverse Fund | No |
| Leveraged Fund | -- |
| Fund of Funds | No |
| Currency Hedged Fund | -- |
| Socially Responsible Fund | No |
Top Portfolio Holders
| Name | % Weight |
|---|---|
| Portfolio A | 5.00% |
| Portfolio B | 3.50% |
| Portfolio C | 2.25% |
Excel Add-In Codes
| Name: =YCI("M:DFCMX", "name") |
| Broad Asset Class: =YCI("M:DFCMX", "broad_asset_class") |
| Broad Category: =YCI("M:DFCMX", "broad_category_group") |
| Prospectus Objective: =YCI("M:DFCMX", "prospectus_objective") |
| To find the codes for any of our securities and financial metrics, see our Complete Excel Reference. |