

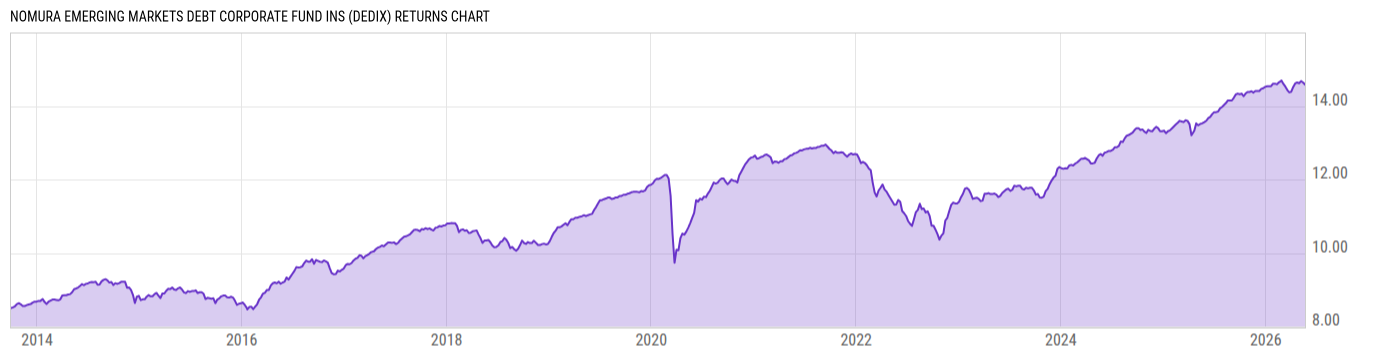
Nomura Emerging Markets Debt Corporate Fund Ins (DEDIX)
7.75
-0.01
(-0.13%)
USD |
Jun 08 2026
Returns Chart
Key Stats
| Net Expense Ratio | Total Assets Under Management | Weighted Average Dividend Yield | Turnover Ratio (Generic) |
|---|---|---|---|
| 0.80% | 72.48M | -- | 89.00% |
| 1 Year Fund Level Flows | 1 Year Total Returns (Daily) | Annualized Total Returns Since Inception (Daily) | Max Drawdown (Since Inception) |
| -34.31M | 7.56% |
Basic Info
| Investment Strategy | |
| The Fund seeks current income and secondarily capital appreciation. The Fund will invest at least 80% of its net assets in a variety of performing interest bearing debt instruments denominated in the currencies of members of the Organization for Economic Cooperation and Development and other emerging markets' currencies. |
| General | |
| Security Type | Mutual Fund |
| Equity Style | -- |
| Broad Asset Class | Taxable Bond |
| Broad Category | Fixed Income |
| Global Peer Group | Bond Emerging Markets Global HC |
| Peer Group | Emerging Mrkts Hard Currency Debt Funds |
| Global Macro | Bond Emerging Markets |
| US Macro | Emerging Markets Debt Funds |
| YCharts Categorization | -- |
| YCharts Benchmark | -- |
| Prospectus Objective | Emerging Mrkts Hard Currency Debt Funds |
| Fund Owner Firm Name | Nomura Asset Management |
| Broad Asset Class Benchmark Index | |
| ^BBUSATR | 100.0% |
Net Fund Flows Versus Peer Group
1 Month
% Rank:
100
-479.78M
Peer Group Low
234.70M
Peer Group High
1 Year
% Rank:
75
-34.31M
-1.381B
Peer Group Low
3.137B
Peer Group High
3 Months
% Rank:
80
-2.227B
Peer Group Low
2.507B
Peer Group High
3 Years
% Rank:
56
-4.106B
Peer Group Low
4.991B
Peer Group High
6 Months
% Rank:
78
-1.796B
Peer Group Low
2.871B
Peer Group High
5 Years
% Rank:
48
-6.046B
Peer Group Low
4.725B
Peer Group High
YTD
% Rank:
87
-2.725B
Peer Group Low
2.885B
Peer Group High
10 Years
% Rank:
52
-6.580B
Peer Group Low
6.009B
Peer Group High
Date Unavailable
Risk
Performance Versus Peer Group
Annual Total Returns Versus Peers
As of June 09, 2026.
Asset Allocation
As of March 31, 2026.
| Type | % Net |
|---|---|
| Cash | 3.62% |
| Stock | 0.42% |
| Bond | 95.97% |
| Convertible | 0.00% |
| Preferred | 0.00% |
| Other | -0.00% |
Top 10 Holdings
| Name | % Weight | Price | % Change |
|---|---|---|---|
| Goldman Sachs FS Government Fund Institutional | 1.78% | 1.00 | 0.00% |
| Fidelity Instl Government Portfolio I | 1.78% | 1.00 | 0.00% |
| BlackRock Liquidity FedFund Institutional | 1.78% | 1.00 | 0.00% |
| Morgan Stanley Inst Liq Govt Port Institutional | 1.78% | 1.00 | 0.00% |
| OVERSEA-CHINESE BANKING CORPORATION LIMITED OCBC 4.55 09/08/2035 FLT USD Corporate 144A '30 | 1.21% | 98.51 | 0.23% |
| Yapi ve Kredi Bankasi A.S. YAPI 7.55 06/11/2036 FLT USD Corporate 144A '31 | 1.04% | 97.96 | 0.08% |
| NOVA Securitisation S.a r.l. NOVASEC 6.5 02/03/2036 FIX USD Corporate 144A | 1.03% | 95.00 | 0.07% |
|
BANK MUSCAT SAOG 4.846% 01-OCT-2030
|
0.99% | -- | -- |
| AL JAWAHER ASSETS COMPANY SPC AJAWAH 4.662 10/29/2030 FIX USD Corporate 144A | 0.99% | 98.22 | 0.00% |
| Kingston Airport Revenue Finance Limited KINGSAI 6.75 12/15/2036 FIX USD Corporate 144A | 0.97% | 100.86 | 0.27% |
Fees & Availability
| Fees | |
| Actual 12B-1 Fee | -- |
| Actual Management Fee | 0.44% |
| Administration Fee | -- |
| Maximum Front Load | -- |
| Maximum Deferred Load | -- |
| Maximum Redemption Fee | -- |
| General Availability | |
| Available for Insurance Product | No |
| Available for RRSP | No |
| Purchase Details | |
| Open to New Investors |
|
| Minimum Initial Investment | 0.00 None |
| Minimum Subsequent Investment | 0.00 None |
Basic Info
| Investment Strategy | |
| The Fund seeks current income and secondarily capital appreciation. The Fund will invest at least 80% of its net assets in a variety of performing interest bearing debt instruments denominated in the currencies of members of the Organization for Economic Cooperation and Development and other emerging markets' currencies. |
| General | |
| Security Type | Mutual Fund |
| Equity Style | -- |
| Broad Asset Class | Taxable Bond |
| Broad Category | Fixed Income |
| Global Peer Group | Bond Emerging Markets Global HC |
| Peer Group | Emerging Mrkts Hard Currency Debt Funds |
| Global Macro | Bond Emerging Markets |
| US Macro | Emerging Markets Debt Funds |
| YCharts Categorization | -- |
| YCharts Benchmark | -- |
| Prospectus Objective | Emerging Mrkts Hard Currency Debt Funds |
| Fund Owner Firm Name | Nomura Asset Management |
| Broad Asset Class Benchmark Index | |
| ^BBUSATR | 100.0% |
Fundamentals
| General | |
| Distribution Yield | -- |
| Dividend Yield TTM (6-5-26) | 5.78% |
| 30-Day SEC Yield (4-30-26) | 5.32% |
| 7-Day SEC Yield | -- |
| Number of Holdings | 150 |
| Bond | |
| Yield to Maturity (3-31-26) | 6.54% |
| Effective Duration | 4.33 |
| Average Coupon | 6.54% |
| Calculated Average Quality | 4.575 |
| Effective Maturity | 8.309 |
| Nominal Maturity | 9.790 |
| Number of Bond Holdings | 136 |
As of March 31, 2026
Fund Details
Top Portfolio Holders
| Name | % Weight |
|---|---|
| Portfolio A | 5.00% |
| Portfolio B | 3.50% |
| Portfolio C | 2.25% |
Excel Add-In Codes
| Name: =YCI("M:DEDIX", "name") |
| Broad Asset Class: =YCI("M:DEDIX", "broad_asset_class") |
| Broad Category: =YCI("M:DEDIX", "broad_category_group") |
| Prospectus Objective: =YCI("M:DEDIX", "prospectus_objective") |
| To find the codes for any of our securities and financial metrics, see our Complete Excel Reference. |