

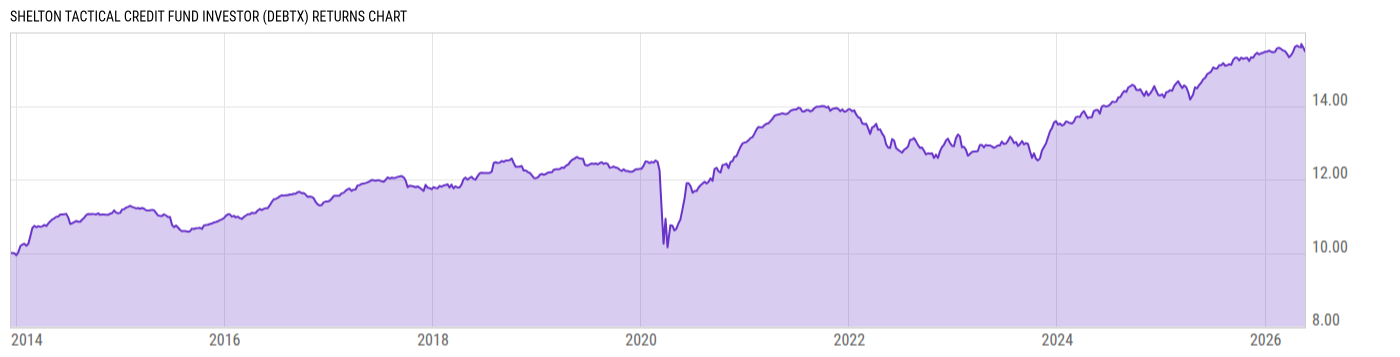
Shelton Tactical Credit Fund Investor (DEBTX)
10.28
-0.01
(-0.10%)
USD |
Jun 09 2026
Returns Chart
Key Stats
| Net Expense Ratio | Total Assets Under Management | Weighted Average Dividend Yield | Turnover Ratio (Generic) |
|---|---|---|---|
| 0.99% | 59.61M | -- | 107.0% |
| 1 Year Fund Level Flows | 1 Year Total Returns (Daily) | Annualized Total Returns Since Inception (Daily) | Max Drawdown (Since Inception) |
| 20.12M | 5.90% |
Basic Info
| Investment Strategy | |
| The Fund seeks capital appreciation and income. The Fund will invest at least 80% of its net assets in various credit-related instruments. The Fund may invest its total assets in debt securities of any maturity and credit quality, including securities that are rated at the time of investment below investment grade. |
| General | |
| Security Type | Mutual Fund |
| Equity Style | -- |
| Broad Asset Class | Taxable Bond |
| Broad Category | Alternative Strategies |
| Global Peer Group | Absolute Return Bond USD |
| Peer Group | Absolute Return Bond Funds |
| Global Macro | Alternative Bond |
| US Macro | Alternative Bond Funds |
| YCharts Categorization | -- |
| YCharts Benchmark | -- |
| Prospectus Objective | Absolute Return Bond Funds |
| Fund Owner Firm Name | ICON |
| Broad Asset Class Benchmark Index | |
| ^BBUSATR | 100.0% |
Net Fund Flows Versus Peer Group
1 Month
% Rank:
55
-209.47M
Peer Group Low
154.84M
Peer Group High
1 Year
% Rank:
49
20.12M
-1.520B
Peer Group Low
1.173B
Peer Group High
3 Months
% Rank:
49
-434.27M
Peer Group Low
314.37M
Peer Group High
3 Years
% Rank:
48
-797.94M
Peer Group Low
4.557B
Peer Group High
6 Months
% Rank:
58
-735.93M
Peer Group Low
552.16M
Peer Group High
5 Years
% Rank:
46
-2.546B
Peer Group Low
4.706B
Peer Group High
YTD
% Rank:
64
-521.26M
Peer Group Low
591.05M
Peer Group High
10 Years
% Rank:
68
-6.734B
Peer Group Low
9.278B
Peer Group High
Date Unavailable
Risk
Performance Versus Peer Group
Annual Total Returns Versus Peers
As of June 09, 2026.
Asset Allocation
As of March 31, 2026.
| Type | % Net |
|---|---|
| Cash | 1.52% |
| Stock | 1.03% |
| Bond | 98.86% |
| Convertible | 0.00% |
| Preferred | 0.00% |
| Other | -1.41% |
Top 10 Holdings
| Name | % Weight | Price | % Change |
|---|---|---|---|
| United States of America USGB 05/28/2026 FIX USD Government (Matured) | 6.56% | 100.00 | 0.01% |
| Iron Mountain Incorporated IRONMOAF 6.25 01/15/2033 FIX USD Corporate 144A | 3.46% | 101.04 | 0.14% |
| Sirius XM Radio LLC SIRIXMAB 3.875 09/01/2031 FIX USD Corporate 144A | 3.15% | 90.55 | -0.10% |
| 1261229 B.C. LTD. BCEC 10.0 04/15/2032 FIX USD Corporate 144A | 3.11% | 101.78 | -0.02% |
| MARS, INCORPORATED MARSINC 5.65 05/01/2045 FIX USD Corporate 144A | 3.00% | 98.82 | 0.55% |
| WMG Acquisition Corp. WMG 3.0 02/15/2031 FIX USD Corporate 144A | 2.79% | 92.29 | 0.06% |
| TALOS PRODUCTION INC. TALOSPR 9.375 02/01/2031 FIX USD Corporate 144A | 2.76% | 106.21 | -0.04% |
| Acushnet Company ACUSCOM 5.625 12/01/2033 FIX USD Corporate 144A | 2.59% | 99.43 | 0.12% |
| Cinemark USA, Inc. CINM-USA 5.25 07/15/2028 FIX USD Corporate 144A | 2.58% | 99.38 | 0.04% |
| Guitar Center, Inc. GUITC 8.5 01/15/2029 FIX USD Corporate 144A | 2.58% | 85.03 | -0.21% |
Fees & Availability
| Fees | |
| Actual 12B-1 Fee | 0.25% |
| Actual Management Fee | 0.35% |
| Administration Fee | 2.09K% |
| Maximum Front Load | -- |
| Maximum Deferred Load | -- |
| Maximum Redemption Fee | 0.00% |
| General Availability | |
| Available for Insurance Product | No |
| Available for RRSP | No |
| Purchase Details | |
| Open to New Investors |
|
| Minimum Initial Investment | 1000.00 None |
| Minimum Subsequent Investment | 1000.00 None |
Basic Info
| Investment Strategy | |
| The Fund seeks capital appreciation and income. The Fund will invest at least 80% of its net assets in various credit-related instruments. The Fund may invest its total assets in debt securities of any maturity and credit quality, including securities that are rated at the time of investment below investment grade. |
| General | |
| Security Type | Mutual Fund |
| Equity Style | -- |
| Broad Asset Class | Taxable Bond |
| Broad Category | Alternative Strategies |
| Global Peer Group | Absolute Return Bond USD |
| Peer Group | Absolute Return Bond Funds |
| Global Macro | Alternative Bond |
| US Macro | Alternative Bond Funds |
| YCharts Categorization | -- |
| YCharts Benchmark | -- |
| Prospectus Objective | Absolute Return Bond Funds |
| Fund Owner Firm Name | ICON |
| Broad Asset Class Benchmark Index | |
| ^BBUSATR | 100.0% |
Fundamentals
| General | |
| Distribution Yield | -- |
| Dividend Yield TTM (6-8-26) | 5.64% |
| 30-Day SEC Yield (5-31-26) | 5.83% |
| 7-Day SEC Yield | -- |
| Number of Holdings | 60 |
| Bond | |
| Yield to Maturity (3-31-26) | 6.64% |
| Effective Duration | -- |
| Average Coupon | 6.90% |
| Calculated Average Quality | 4.992 |
| Effective Maturity | 8.168 |
| Nominal Maturity | 8.352 |
| Number of Bond Holdings | 54 |
As of March 31, 2026
Fund Details
| Key Dates | |
| Inception Date | 12/12/2013 |
| Last Annual Report Date | 12/31/2025 |
| Last Prospectus Date | 5/1/2026 |
| Share Classes | |
| DEBIX | Inst |
| Attributes | |
| Index Fund | -- |
| Inverse Fund | No |
| Leveraged Fund | -- |
| Fund of Funds | No |
| Currency Hedged Fund | -- |
| Socially Responsible Fund | No |
Top Portfolio Holders
| Name | % Weight |
|---|---|
| Portfolio A | 5.00% |
| Portfolio B | 3.50% |
| Portfolio C | 2.25% |
Excel Add-In Codes
| Name: =YCI("M:DEBTX", "name") |
| Broad Asset Class: =YCI("M:DEBTX", "broad_asset_class") |
| Broad Category: =YCI("M:DEBTX", "broad_category_group") |
| Prospectus Objective: =YCI("M:DEBTX", "prospectus_objective") |
| To find the codes for any of our securities and financial metrics, see our Complete Excel Reference. |