

Dunham Floating Rate Bond Fund A (DAFRX)
8.40
+0.01
(+0.12%)
USD |
May 21 2026
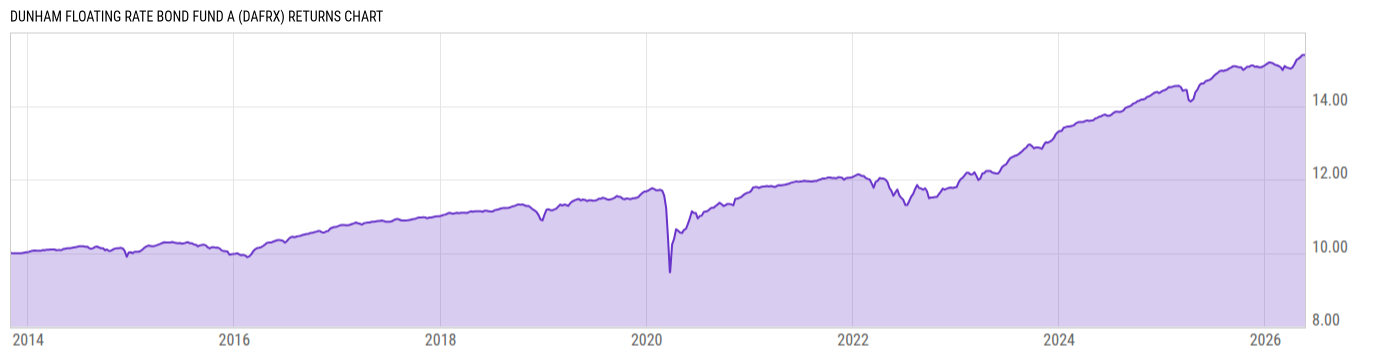
Returns Chart
Key Stats
| Net Expense Ratio | Total Assets Under Management | Weighted Average Dividend Yield | Turnover Ratio (Generic) |
|---|---|---|---|
| 1.33% | 226.09M | -- | -- |
| 1 Year Fund Level Flows | 1 Year Total Returns (Daily) | Annualized Total Returns Since Inception (Daily) | Max Drawdown (Since Inception) |
| 47.46M | 5.27% |
Basic Info
| Investment Strategy | |
| The Fund seeks high level of current income, with capital appreciation as a secondary goal. It will normally invest at least 80% of its assets in bonds, defined by the Fund as floating rate loans and other floating rate debt securities. The loans in which the Fund will primarily invest are non-investment grade bank loans. |
| General | |
| Security Type | Mutual Fund |
| Equity Style | -- |
| Broad Asset Class | Taxable Bond |
| Broad Category | Fixed Income |
| Global Peer Group | Loan Participation Funds |
| Peer Group | Loan Participation Funds |
| Global Macro | Loan Participation Funds |
| US Macro | General Domestic Taxable Fixed Income Funds |
| YCharts Categorization | -- |
| YCharts Benchmark | -- |
| Prospectus Objective | Loan Participation Funds |
| Fund Owner Firm Name | Dunham Funds |
| Broad Asset Class Benchmark Index | |
| ^BBUSATR | 100.0% |
Net Fund Flows Versus Peer Group
1 Month
% Rank:
18
-253.42M
Peer Group Low
759.64M
Peer Group High
1 Year
% Rank:
16
47.46M
-2.001B
Peer Group Low
5.560B
Peer Group High
3 Months
% Rank:
12
-1.463B
Peer Group Low
1.631B
Peer Group High
3 Years
% Rank:
20
-2.784B
Peer Group Low
21.89B
Peer Group High
6 Months
% Rank:
16
-1.675B
Peer Group Low
3.793B
Peer Group High
5 Years
% Rank:
35
-4.082B
Peer Group Low
24.26B
Peer Group High
YTD
% Rank:
14
-1.576B
Peer Group Low
2.664B
Peer Group High
10 Years
% Rank:
29
-10.84B
Peer Group Low
24.98B
Peer Group High
Date Unavailable
Risk
Performance Versus Peer Group
Annual Total Returns Versus Peers
As of May 22, 2026.
Asset Allocation
As of March 31, 2026.
| Type | % Net |
|---|---|
| Cash | 4.11% |
| Stock | 0.03% |
| Bond | 103.2% |
| Convertible | 0.00% |
| Preferred | 0.00% |
| Other | -7.30% |
Top 10 Holdings
| Name | % Weight | Price | % Change |
|---|---|---|---|
| Fidelity Instl Government Portfolio I | 8.81% | 1.00 | 0.00% |
|
BLUEMOUNTAIN CLO LTD. 33R ER SEQ FLT 10.59763% 20-OCT-2038
|
1.44% | -- | -- |
|
BAIN CAPITAL CREDIT CLO 217R ER SEQ FLT 10.1692% 22-JAN-2035
|
1.12% | -- | -- |
|
Oak-Eagle AcquireCo Inc FRN
|
1.11% | -- | -- |
|
Jane Street Group LLC FRN 11-Dec-2031
|
1.00% | -- | -- |
|
Neptune Bidco US Inc FRN
|
0.98% | -- | -- |
|
BLUEMOUNTAIN CLO LTD. 32R ER SEQ FLT 10.27219% 16-OCT-2034
|
0.97% | -- | -- |
|
Azuria Water Solutions Inc FRN 27-Jan-2033
|
0.92% | -- | -- |
|
Varsity Brands Inc FRN 26-Aug-2031
|
0.91% | -- | -- |
|
Asurion LLC FRN 19-Sep-2030
|
0.91% | -- | -- |
Fees & Availability
| Fees | |
| Actual 12B-1 Fee | 0.25% |
| Actual Management Fee | 0.79% |
| Administration Fee | 7.27K% |
| Maximum Front Load | 4.50% |
| Maximum Deferred Load | -- |
| Maximum Redemption Fee | -- |
| General Availability | |
| Available for Insurance Product | No |
| Available for RRSP | No |
| Purchase Details | |
| Open to New Investors |
|
| Minimum Initial Investment | 5000.00 None |
| Minimum Subsequent Investment | 100.00 None |
Basic Info
| Investment Strategy | |
| The Fund seeks high level of current income, with capital appreciation as a secondary goal. It will normally invest at least 80% of its assets in bonds, defined by the Fund as floating rate loans and other floating rate debt securities. The loans in which the Fund will primarily invest are non-investment grade bank loans. |
| General | |
| Security Type | Mutual Fund |
| Equity Style | -- |
| Broad Asset Class | Taxable Bond |
| Broad Category | Fixed Income |
| Global Peer Group | Loan Participation Funds |
| Peer Group | Loan Participation Funds |
| Global Macro | Loan Participation Funds |
| US Macro | General Domestic Taxable Fixed Income Funds |
| YCharts Categorization | -- |
| YCharts Benchmark | -- |
| Prospectus Objective | Loan Participation Funds |
| Fund Owner Firm Name | Dunham Funds |
| Broad Asset Class Benchmark Index | |
| ^BBUSATR | 100.0% |
Fundamentals
| General | |
| Distribution Yield | -- |
| Dividend Yield TTM (5-20-26) | 7.35% |
| 30-Day SEC Yield (3-31-26) | 6.60% |
| 7-Day SEC Yield | -- |
| Number of Holdings | 264 |
| Bond | |
| Yield to Maturity (3-31-26) | 8.05% |
| Effective Duration | -- |
| Average Coupon | 7.87% |
| Calculated Average Quality | 5.573 |
| Effective Maturity | 5.178 |
| Nominal Maturity | 5.263 |
| Number of Bond Holdings | 258 |
As of March 31, 2026
Fund Details
Top Portfolio Holders
| Name | % Weight |
|---|---|
| Portfolio A | 5.00% |
| Portfolio B | 3.50% |
| Portfolio C | 2.25% |
Excel Add-In Codes
| Name: =YCI("M:DAFRX", "name") |
| Broad Asset Class: =YCI("M:DAFRX", "broad_asset_class") |
| Broad Category: =YCI("M:DAFRX", "broad_category_group") |
| Prospectus Objective: =YCI("M:DAFRX", "prospectus_objective") |
| To find the codes for any of our securities and financial metrics, see our Complete Excel Reference. |