

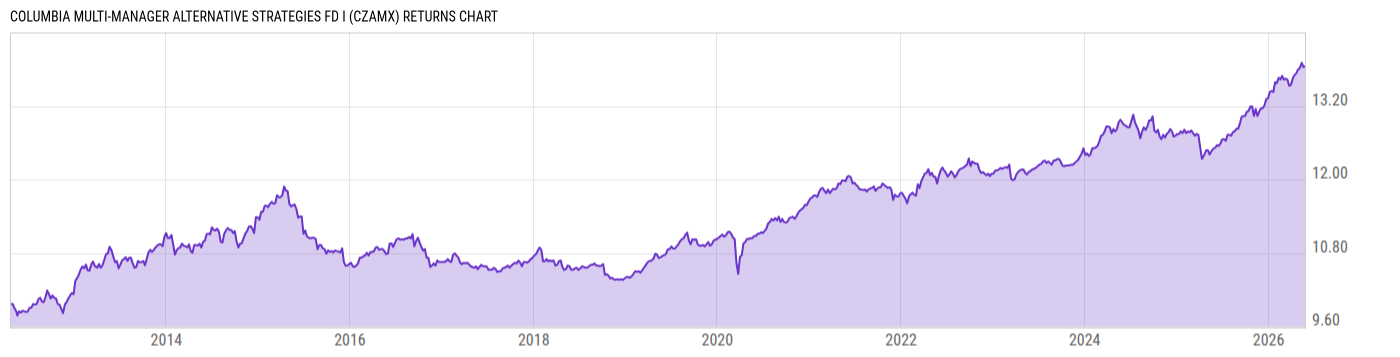
Columbia Multi-Manager Alternative Strategies Fd I (CZAMX)
9.57
+0.01
(+0.10%)
USD |
May 26 2026
Returns Chart
Key Stats
| Net Expense Ratio | Total Assets Under Management | Weighted Average Dividend Yield | Turnover Ratio (Generic) |
|---|---|---|---|
| 1.28% | 616.15M | -- | 126.0% |
| 1 Year Fund Level Flows | 1 Year Total Returns (Daily) | Annualized Total Returns Since Inception (Daily) | Max Drawdown (Since Inception) |
| 100.50M | 11.00% |
Basic Info
| Investment Strategy | |
| The Fund seeks capital appreciation with an emphasis on absolute positive returns. Its objective, is allocating Funds assets among different asset managers that use multiple investment styles & strategies across different markets. Making substantial use of derivatives, including both exchange-traded and OTC instruments. |
| General | |
| Security Type | Mutual Fund |
| Equity Style | -- |
| Broad Asset Class | Alternative |
| Broad Category | Alternative Strategies |
| Global Peer Group | Alternative Multi Strategies |
| Peer Group | Alternative Multi-Strategy Funds |
| Global Macro | Liquid Alternatives |
| US Macro | Alternative Equity Funds |
| YCharts Categorization | -- |
| YCharts Benchmark | -- |
| Prospectus Objective | Alternative Multi-Strategy Funds |
| Fund Owner Firm Name | Columbia Threadneedle Investments |
| Broad Asset Class Benchmark Index | |
| ^MSACWINTR | 100.0% |
Net Fund Flows Versus Peer Group
1 Month
% Rank:
88
-57.14M
Peer Group Low
449.76M
Peer Group High
1 Year
% Rank:
17
100.50M
-552.08M
Peer Group Low
4.649B
Peer Group High
3 Months
% Rank:
10
-220.49M
Peer Group Low
1.193B
Peer Group High
3 Years
% Rank:
37
-1.806B
Peer Group Low
6.229B
Peer Group High
6 Months
% Rank:
16
-247.22M
Peer Group Low
2.749B
Peer Group High
5 Years
% Rank:
45
-2.319B
Peer Group Low
6.492B
Peer Group High
YTD
% Rank:
10
-183.82M
Peer Group Low
2.170B
Peer Group High
10 Years
% Rank:
76
-3.287B
Peer Group Low
6.881B
Peer Group High
Date Unavailable
Risk
Performance Versus Peer Group
Annual Total Returns Versus Peers
As of May 27, 2026.
Asset Allocation
As of March 31, 2026.
| Type | % Net |
|---|---|
| Cash | 27.36% |
| Stock | 0.06% |
| Bond | 67.12% |
| Convertible | 0.00% |
| Preferred | 1.14% |
| Other | 4.31% |
Top 10 Holdings
| Name | % Weight | Price | % Change |
|---|---|---|---|
|
Columbia Short-Term Cash Fund
|
27.36% | -- | -- |
| Carvana Co. CARVCO 9.0 06/01/2030 VAR USD Corporate 144A | 1.00% | 103.78 | -0.03% |
| MAXIM CRANE WORKS HOLDINGS CAPITAL, LLC MAXCRA 11.5 09/01/2028 FIX USD Corporate 144A | 0.99% | 104.61 | 0.04% |
|
Federal National Mortgage Association 3.5% 01-APR-2056
|
0.94% | -- | -- |
|
Federal National Mortgage Association 5% 01-APR-2056
|
0.92% | -- | -- |
|
Government National Mortgage Association 2 4% 01-APR-2056
|
0.66% | -- | -- |
| EchoStar Corporation ECHO 10.75 11/30/2029 FIX USD Corporate | 0.54% | 108.67 | 0.05% |
|
Federal National Mortgage Association 5.5% 01-APR-2056
|
0.52% | -- | -- |
| R.R. Donnelley & Sons Company DNY 9.5 08/01/2029 FIX USD Corporate 144A | 0.50% | 103.89 | 0.31% |
| FREEDOM MORTGAGE HOLDINGS LLC FREEDMO 9.25 02/01/2029 FIX USD Corporate 144A | 0.50% | 103.74 | -0.13% |
Fees & Availability
| Fees | |
| Actual 12B-1 Fee | -- |
| Actual Management Fee | 1.10% |
| Administration Fee | -- |
| Maximum Front Load | -- |
| Maximum Deferred Load | -- |
| Maximum Redemption Fee | -- |
| General Availability | |
| Available for Insurance Product | No |
| Available for RRSP | No |
| Purchase Details | |
| Open to New Investors |
|
| Minimum Initial Investment | 2000.00 None |
| Minimum Subsequent Investment | 0.00 None |
Basic Info
| Investment Strategy | |
| The Fund seeks capital appreciation with an emphasis on absolute positive returns. Its objective, is allocating Funds assets among different asset managers that use multiple investment styles & strategies across different markets. Making substantial use of derivatives, including both exchange-traded and OTC instruments. |
| General | |
| Security Type | Mutual Fund |
| Equity Style | -- |
| Broad Asset Class | Alternative |
| Broad Category | Alternative Strategies |
| Global Peer Group | Alternative Multi Strategies |
| Peer Group | Alternative Multi-Strategy Funds |
| Global Macro | Liquid Alternatives |
| US Macro | Alternative Equity Funds |
| YCharts Categorization | -- |
| YCharts Benchmark | -- |
| Prospectus Objective | Alternative Multi-Strategy Funds |
| Fund Owner Firm Name | Columbia Threadneedle Investments |
| Broad Asset Class Benchmark Index | |
| ^MSACWINTR | 100.0% |
Fundamentals
| General | |
| Distribution Yield | -- |
| Dividend Yield TTM (5-22-26) | 3.08% |
| 30-Day SEC Yield | -- |
| 7-Day SEC Yield | -- |
| Number of Holdings | 1070 |
| Bond | |
| Yield to Maturity (3-31-26) | 6.39% |
| Effective Duration | -- |
| Average Coupon | 6.99% |
| Calculated Average Quality | 4.336 |
| Effective Maturity | 12.82 |
| Nominal Maturity | 13.07 |
| Number of Bond Holdings | 971 |
As of March 31, 2026
Fund Details
| Key Dates | |
| Inception Date | 4/23/2012 |
| Last Annual Report Date | 8/31/2025 |
| Last Prospectus Date | 1/1/2026 |
| Attributes | |
| Index Fund | -- |
| Inverse Fund | No |
| Leveraged Fund | -- |
| Fund of Funds | No |
| Currency Hedged Fund | -- |
| Socially Responsible Fund | No |
Top Portfolio Holders
| Name | % Weight |
|---|---|
| Portfolio A | 5.00% |
| Portfolio B | 3.50% |
| Portfolio C | 2.25% |
Excel Add-In Codes
| Name: =YCI("M:CZAMX", "name") |
| Broad Asset Class: =YCI("M:CZAMX", "broad_asset_class") |
| Broad Category: =YCI("M:CZAMX", "broad_category_group") |
| Prospectus Objective: =YCI("M:CZAMX", "prospectus_objective") |
| To find the codes for any of our securities and financial metrics, see our Complete Excel Reference. |