

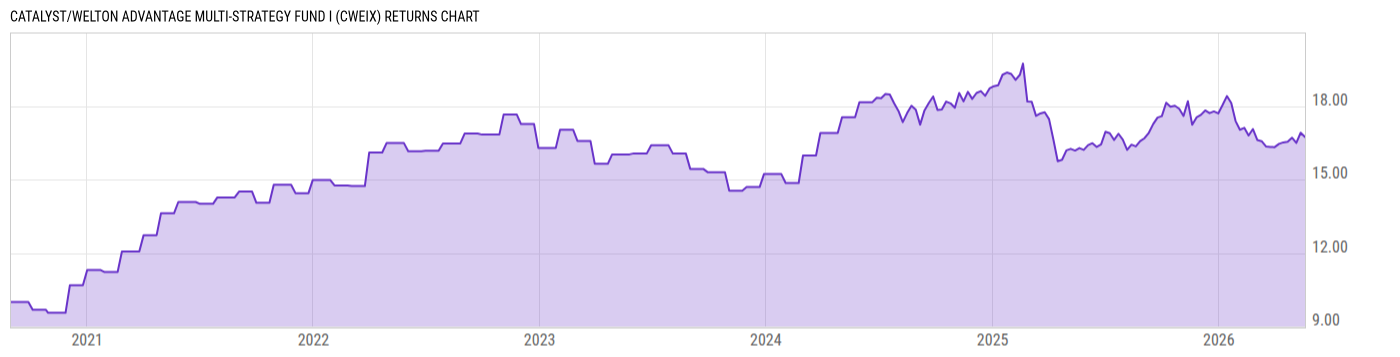
Catalyst/Welton Advantage Multi-Strategy Fund I (CWEIX)
16.38
-0.07
(-0.43%)
USD |
Jun 09 2026
Returns Chart
Key Stats
| Net Expense Ratio | Total Assets Under Management | Weighted Average Dividend Yield | Turnover Ratio (Generic) |
|---|---|---|---|
| 2.02% | 46.55M | -- | 2.58K% |
| 1 Year Fund Level Flows | 1 Year Total Returns (Daily) | Annualized Total Returns Since Inception (Daily) | Max Drawdown (Since Inception) |
| -2.770M | 0.55% |
Basic Info
| Investment Strategy | |
| The Fund seeks long-term capital appreciation. The Fund seeks to achieve its investment objective through a multi-asset trading strategy, the Welton Advantage Multi-Strategy, that invests in domestic equity securities along with a group of global derivative markets spanning four major market sectors. |
| General | |
| Security Type | Mutual Fund |
| Equity Style | -- |
| Broad Asset Class | Alternative |
| Broad Category | Alternative Strategies |
| Global Peer Group | Alternative Multi Strategies |
| Peer Group | Alternative Multi-Strategy Funds |
| Global Macro | Liquid Alternatives |
| US Macro | Alternative Equity Funds |
| YCharts Categorization | -- |
| YCharts Benchmark | -- |
| Prospectus Objective | Alternative Multi-Strategy Funds |
| Fund Owner Firm Name | Catalyst Funds |
| Broad Asset Class Benchmark Index | |
| ^MSACWINTR | 100.0% |
Net Fund Flows Versus Peer Group
1 Month
% Rank:
66
-140.05M
Peer Group Low
558.92M
Peer Group High
1 Year
% Rank:
50
-2.770M
-552.08M
Peer Group Low
4.649B
Peer Group High
3 Months
% Rank:
63
-74.70M
Peer Group Low
1.340B
Peer Group High
3 Years
% Rank:
35
-1.663B
Peer Group Low
6.757B
Peer Group High
6 Months
% Rank:
54
-244.92M
Peer Group Low
2.749B
Peer Group High
5 Years
% Rank:
44
-2.277B
Peer Group Low
7.050B
Peer Group High
YTD
% Rank:
63
-195.06M
Peer Group Low
2.292B
Peer Group High
10 Years
% Rank:
50
-3.121B
Peer Group Low
7.072B
Peer Group High
Date Unavailable
Risk
Performance Versus Peer Group
Annual Total Returns Versus Peers
As of June 10, 2026.
Asset Allocation
As of March 31, 2026.
| Type | % Net |
|---|---|
| Cash | 20.18% |
| Stock | 29.50% |
| Bond | 48.77% |
| Convertible | 0.00% |
| Preferred | 0.00% |
| Other | 1.55% |
Top 10 Holdings
| Name | % Weight | Price | % Change |
|---|---|---|---|
| United States of America USGB 04/23/2026 FIX USD Government (Matured) | 36.66% | 100.00 | 0.01% |
| First American Treasury Obligations Fund X | 23.31% | 1.00 | 0.00% |
|
CWAMSF Fund Ltd
|
13.33% | -- | -- |
|
USD Cash
|
9.18% | -- | -- |
|
Other Assets less Liabilities
|
1.53% | -- | -- |
| Apple, Inc. | 0.52% | 291.63 | 0.37% |
| PepsiCo, Inc. | 0.48% | 144.31 | 1.07% |
| T-Mobile US, Inc. | 0.43% | 185.54 | 3.39% |
| AT&T, Inc. | 0.42% | 23.20 | 2.14% |
| Bank of America Corp. | 0.40% | 54.54 | 0.23% |
Fees & Availability
| Fees | |
| Actual 12B-1 Fee | -- |
| Actual Management Fee | 1.24% |
| Administration Fee | 50.50K% |
| Maximum Front Load | -- |
| Maximum Deferred Load | -- |
| Maximum Redemption Fee | -- |
| General Availability | |
| Available for Insurance Product | No |
| Available for RRSP | No |
| Purchase Details | |
| Open to New Investors |
|
| Minimum Initial Investment | 2500.00 None |
| Minimum Subsequent Investment | 50.00 None |
Basic Info
| Investment Strategy | |
| The Fund seeks long-term capital appreciation. The Fund seeks to achieve its investment objective through a multi-asset trading strategy, the Welton Advantage Multi-Strategy, that invests in domestic equity securities along with a group of global derivative markets spanning four major market sectors. |
| General | |
| Security Type | Mutual Fund |
| Equity Style | -- |
| Broad Asset Class | Alternative |
| Broad Category | Alternative Strategies |
| Global Peer Group | Alternative Multi Strategies |
| Peer Group | Alternative Multi-Strategy Funds |
| Global Macro | Liquid Alternatives |
| US Macro | Alternative Equity Funds |
| YCharts Categorization | -- |
| YCharts Benchmark | -- |
| Prospectus Objective | Alternative Multi-Strategy Funds |
| Fund Owner Firm Name | Catalyst Funds |
| Broad Asset Class Benchmark Index | |
| ^MSACWINTR | 100.0% |
Fundamentals
| General | |
| Distribution Yield | -- |
| Dividend Yield TTM (6-8-26) | 0.00% |
| 30-Day SEC Yield | -- |
| 7-Day SEC Yield | -- |
| Number of Holdings | 112 |
| Stock | |
| Weighted Average PE Ratio | 27.04 |
| Weighted Average Price to Sales Ratio | 5.516 |
| Weighted Average Price to Book Ratio | 6.868 |
| Weighted Median ROE | 31.79% |
| Weighted Median ROA | 9.23% |
| ROI (TTM) | 15.89% |
| Return on Investment (TTM) | 15.89% |
| Earning Yield | 0.0461 |
| LT Debt / Shareholders Equity | 1.055 |
| Number of Equity Holdings | 80 |
| Bond | |
| Yield to Maturity (3-31-26) | 3.69% |
| Effective Duration | -- |
| Average Coupon | -- |
| Calculated Average Quality | -- |
| Effective Maturity | 0.0618 |
| Nominal Maturity | 0.0618 |
| Number of Bond Holdings | 1 |
As of March 31, 2026
Growth Metrics
| EPS Growth (1Y) | 17.17% |
| EPS Growth (3Y) | 16.92% |
| EPS Growth (5Y) | 18.73% |
| Sales Growth (1Y) | 10.13% |
| Sales Growth (3Y) | 8.14% |
| Sales Growth (5Y) | 10.08% |
| Sales per Share Growth (1Y) | 10.52% |
| Sales per Share Growth (3Y) | 8.58% |
| Operating Cash Flow - Growth Rate (3Y) | 16.27% |
As of March 31, 2026
Top Portfolio Holders
| Name | % Weight |
|---|---|
| Portfolio A | 5.00% |
| Portfolio B | 3.50% |
| Portfolio C | 2.25% |
Excel Add-In Codes
| Name: =YCI("M:CWEIX", "name") |
| Broad Asset Class: =YCI("M:CWEIX", "broad_asset_class") |
| Broad Category: =YCI("M:CWEIX", "broad_category_group") |
| Prospectus Objective: =YCI("M:CWEIX", "prospectus_objective") |
| To find the codes for any of our securities and financial metrics, see our Complete Excel Reference. |