

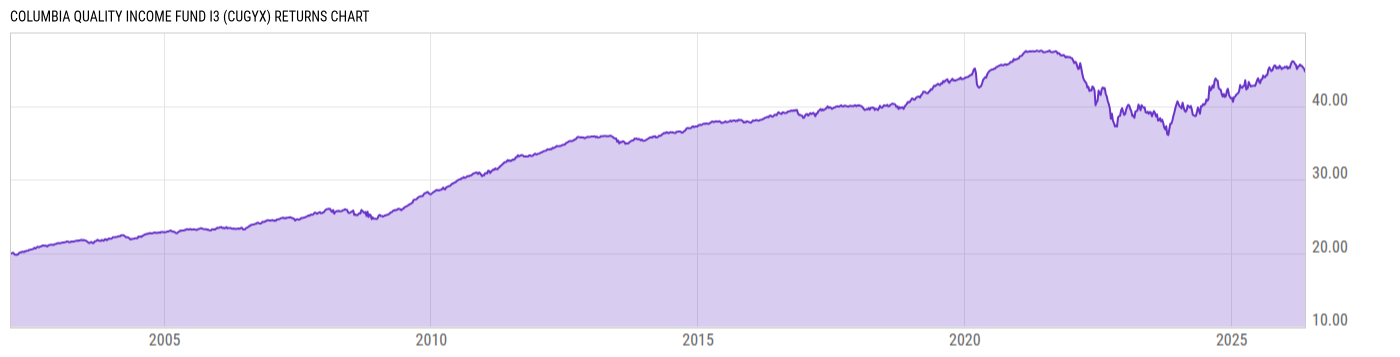
Columbia Quality Income Fund I3 (CUGYX)
17.90
+0.05
(+0.28%)
USD |
Jun 09 2026
Returns Chart
Key Stats
| Net Expense Ratio | Total Assets Under Management | Weighted Average Dividend Yield | Turnover Ratio (Generic) |
|---|---|---|---|
| 0.52% | 1.186B | -- | 330.0% |
| 1 Year Fund Level Flows | 1 Year Total Returns (Daily) | Annualized Total Returns Since Inception (Daily) | Max Drawdown (Since Inception) |
| -136.81M | 5.75% |
Basic Info
| Investment Strategy | |
| The Fund seeks current income as its primary goal, and preservation of capital as its secondary goal, by investing primarily in mortgage-related securities that either are issued or guaranteed as to principal and interest by the U.S. government, its agencies, authorities or instrumentalities. |
| General | |
| Security Type | Mutual Fund |
| Equity Style | -- |
| Broad Asset Class | Taxable Bond |
| Broad Category | Fixed Income |
| Global Peer Group | Bond USD Mortgages |
| Peer Group | U.S. Mortgage Funds |
| Global Macro | Bond HC |
| US Macro | U.S. Government & Treasury Fixed Income Funds |
| YCharts Categorization | -- |
| YCharts Benchmark | -- |
| Prospectus Objective | U.S. Mortgage Funds |
| Fund Owner Firm Name | Columbia Threadneedle Investments |
| Broad Asset Class Benchmark Index | |
| ^BBUSATR | 100.0% |
Net Fund Flows Versus Peer Group
1 Month
% Rank:
28
-105.93M
Peer Group Low
315.90M
Peer Group High
1 Year
% Rank:
92
-136.81M
-2.129B
Peer Group Low
1.463B
Peer Group High
3 Months
% Rank:
36
-583.12M
Peer Group Low
530.19M
Peer Group High
3 Years
% Rank:
89
-6.769B
Peer Group Low
7.386B
Peer Group High
6 Months
% Rank:
53
-1.037B
Peer Group Low
1.036B
Peer Group High
5 Years
% Rank:
93
-18.17B
Peer Group Low
10.59B
Peer Group High
YTD
% Rank:
46
-615.00M
Peer Group Low
724.64M
Peer Group High
10 Years
% Rank:
87
-35.90B
Peer Group Low
25.97B
Peer Group High
Date Unavailable
Risk
Performance Versus Peer Group
Annual Total Returns Versus Peers
As of June 10, 2026.
Asset Allocation
As of March 31, 2026.
| Type | % Net |
|---|---|
| Cash | 9.00% |
| Stock | 0.00% |
| Bond | 90.79% |
| Convertible | 0.00% |
| Preferred | 0.00% |
| Other | 0.21% |
Top 10 Holdings
| Name | % Weight | Price | % Change |
|---|---|---|---|
|
Federal National Mortgage Association 5% 01-APR-2056
|
10.42% | -- | -- |
|
Columbia Short-Term Cash Fund
|
9.00% | -- | -- |
| FNMA-New 04/21/2050 UNKNOWN Agency | 5.26% | 98.23 | -0.00% |
|
Federal National Mortgage Association 4.5% 01-APR-2056
|
4.53% | -- | -- |
|
Federal National Mortgage Association 3.5% 01-APR-2056
|
3.07% | -- | -- |
|
Federal National Mortgage Association 3% 01-APR-2041
|
2.88% | -- | -- |
|
Federal National Mortgage Association 01-AUG-2052 FS2446
|
2.37% | -- | -- |
|
Federal National Mortgage Association 01-NOV-2052 FS8147
|
1.92% | -- | -- |
|
Federal National Mortgage Association 5.5% 01-APR-2056
|
1.85% | -- | -- |
| FEDERAL NATIONAL MORTGAGE ASSOCIATION FNMA-New 6.0 04/15/2033 FIX USD Agency | 1.62% | 102.24 | 0.05% |
Fees & Availability
| Fees | |
| Actual 12B-1 Fee | -- |
| Actual Management Fee | 0.45% |
| Administration Fee | -- |
| Maximum Front Load | -- |
| Maximum Deferred Load | -- |
| Maximum Redemption Fee | -- |
| General Availability | |
| Available for Insurance Product | No |
| Available for RRSP | No |
| Purchase Details | |
| Open to New Investors |
|
| Minimum Initial Investment | 0.00 None |
| Minimum Subsequent Investment | 0.00 None |
Basic Info
| Investment Strategy | |
| The Fund seeks current income as its primary goal, and preservation of capital as its secondary goal, by investing primarily in mortgage-related securities that either are issued or guaranteed as to principal and interest by the U.S. government, its agencies, authorities or instrumentalities. |
| General | |
| Security Type | Mutual Fund |
| Equity Style | -- |
| Broad Asset Class | Taxable Bond |
| Broad Category | Fixed Income |
| Global Peer Group | Bond USD Mortgages |
| Peer Group | U.S. Mortgage Funds |
| Global Macro | Bond HC |
| US Macro | U.S. Government & Treasury Fixed Income Funds |
| YCharts Categorization | -- |
| YCharts Benchmark | -- |
| Prospectus Objective | U.S. Mortgage Funds |
| Fund Owner Firm Name | Columbia Threadneedle Investments |
| Broad Asset Class Benchmark Index | |
| ^BBUSATR | 100.0% |
Fundamentals
| General | |
| Distribution Yield | -- |
| Dividend Yield TTM (6-8-26) | 4.58% |
| 30-Day SEC Yield (5-31-26) | 4.30% |
| 7-Day SEC Yield | -- |
| Number of Holdings | 297 |
| Bond | |
| Yield to Maturity (3-31-26) | 5.27% |
| Effective Duration | 5.64 |
| Average Coupon | 4.81% |
| Calculated Average Quality | 1.201 |
| Effective Maturity | 25.64 |
| Nominal Maturity | 25.64 |
| Number of Bond Holdings | 280 |
As of March 31, 2026
Fund Details
Top Portfolio Holders
| Name | % Weight |
|---|---|
| Portfolio A | 5.00% |
| Portfolio B | 3.50% |
| Portfolio C | 2.25% |
Excel Add-In Codes
| Name: =YCI("M:CUGYX", "name") |
| Broad Asset Class: =YCI("M:CUGYX", "broad_asset_class") |
| Broad Category: =YCI("M:CUGYX", "broad_category_group") |
| Prospectus Objective: =YCI("M:CUGYX", "prospectus_objective") |
| To find the codes for any of our securities and financial metrics, see our Complete Excel Reference. |