

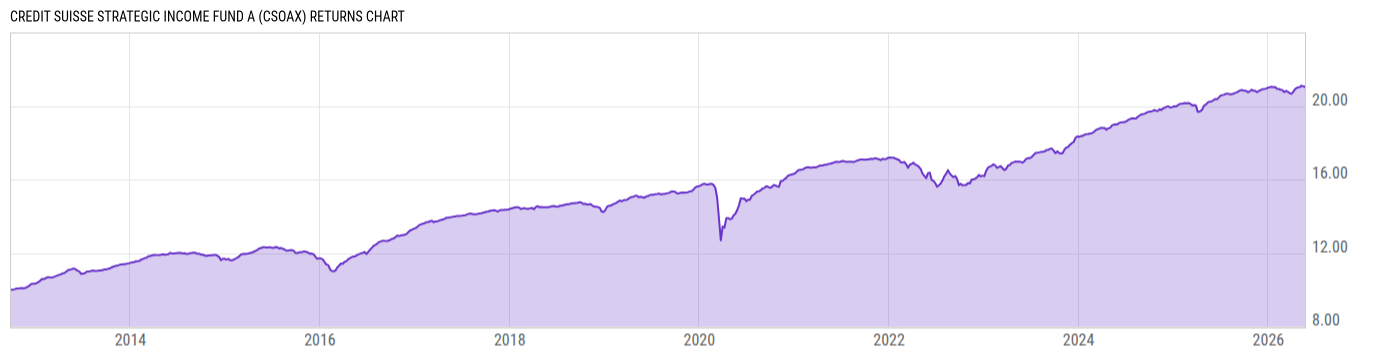
Credit Suisse Strategic Income Fund A (CSOAX)
9.16
-0.01
(-0.11%)
USD |
Jun 09 2026
Returns Chart
Key Stats
| Net Expense Ratio | Total Assets Under Management | Weighted Average Dividend Yield | Turnover Ratio (Generic) |
|---|---|---|---|
| 1.04% | 1.151B | -- | 56.00% |
| 1 Year Fund Level Flows | 1 Year Total Returns (Daily) | Annualized Total Returns Since Inception (Daily) | Max Drawdown (Since Inception) |
| 108.79M | 3.58% |
Basic Info
| Investment Strategy | |
| The Fund seeks total return. The Fund will invest in debt instruments, including those issued by domestic and foreign companies, senior secured floating rate loans, mortgage- and asset-backed securities and collateralized loans, convertible debt securities, and obligations issued by the US and foreign government. |
| General | |
| Security Type | Mutual Fund |
| Equity Style | -- |
| Broad Asset Class | Taxable Bond |
| Broad Category | Fixed Income |
| Global Peer Group | Bond USD |
| Peer Group | Multi-Sector Income Funds |
| Global Macro | Bond HC |
| US Macro | General Domestic Taxable Fixed Income Funds |
| YCharts Categorization | -- |
| YCharts Benchmark | -- |
| Prospectus Objective | Multi-Sector Income Funds |
| Fund Owner Firm Name | UBS Asset Management |
| Broad Asset Class Benchmark Index | |
| ^BBUSATR | 100.0% |
Net Fund Flows Versus Peer Group
1 Month
% Rank:
91
-144.76M
Peer Group Low
572.86M
Peer Group High
1 Year
% Rank:
35
108.79M
-1.545B
Peer Group Low
30.94B
Peer Group High
3 Months
% Rank:
83
-480.71M
Peer Group Low
1.683B
Peer Group High
3 Years
% Rank:
22
-4.573B
Peer Group Low
71.08B
Peer Group High
6 Months
% Rank:
45
-777.58M
Peer Group Low
12.53B
Peer Group High
5 Years
% Rank:
25
-7.509B
Peer Group Low
61.00B
Peer Group High
YTD
% Rank:
42
-627.92M
Peer Group Low
8.773B
Peer Group High
10 Years
% Rank:
30
-13.91B
Peer Group Low
116.77B
Peer Group High
Date Unavailable
Risk
Performance Versus Peer Group
Annual Total Returns Versus Peers
As of June 10, 2026.
Asset Allocation
As of January 31, 2026.
| Type | % Net |
|---|---|
| Cash | 4.06% |
| Stock | 0.42% |
| Bond | 102.2% |
| Convertible | 0.00% |
| Preferred | 0.00% |
| Other | -6.69% |
Top 10 Holdings
| Name | % Weight | Price | % Change |
|---|---|---|---|
| State Street US Government Money Market Fund Prem | 8.53% | 1.00 | 0.00% |
|
Authentic Brands Group LLC 21-DEC-2028 Term Loan B
|
1.04% | -- | -- |
| VIRTUSA HOLDCO, INC. VIRHOL 7.125 12/15/2028 FIX USD Corporate 144A | 0.87% | 83.75 | -0.93% |
|
RealPage Inc 22-APR-2028 Delay Draw Term Loan
|
0.80% | -- | -- |
| ARMOR HOLDCO, INC. ARMORHO 8.5 11/15/2029 FIX USD Corporate 144A | 0.80% | 100.60 | 0.02% |
| CQP Holdco LP CQPHOL 7.5 12/15/2033 FIX USD Corporate 144A | 0.79% | 105.54 | -0.00% |
| CoreLogic, Inc. CORLG 4.5 05/01/2028 FIX USD Corporate 144A | 0.70% | 97.98 | -0.08% |
| DEALER TIRE, LLC DEALTIR 8.0 02/01/2028 FIX USD Corporate 144A | 0.67% | 99.21 | -0.08% |
| Speedway Motorsports, LLC SPEMOT 4.875 11/01/2027 FIX USD Corporate 144A | 0.67% | 99.16 | 0.02% |
|
UKG Inc [Ex- Ultimate Software Inc] 09-FEB-2031 Term Loan B
|
0.65% | -- | -- |
Fees & Availability
| Fees | |
| Actual 12B-1 Fee | 0.25% |
| Actual Management Fee | 0.58% |
| Administration Fee | 14.75K% |
| Maximum Front Load | 4.75% |
| Maximum Deferred Load | -- |
| Maximum Redemption Fee | 0.00% |
| General Availability | |
| Available for Insurance Product | No |
| Available for RRSP | No |
| Purchase Details | |
| Open to New Investors |
|
| Minimum Initial Investment | 2500.00 None |
| Minimum Subsequent Investment | 100.00 None |
Basic Info
| Investment Strategy | |
| The Fund seeks total return. The Fund will invest in debt instruments, including those issued by domestic and foreign companies, senior secured floating rate loans, mortgage- and asset-backed securities and collateralized loans, convertible debt securities, and obligations issued by the US and foreign government. |
| General | |
| Security Type | Mutual Fund |
| Equity Style | -- |
| Broad Asset Class | Taxable Bond |
| Broad Category | Fixed Income |
| Global Peer Group | Bond USD |
| Peer Group | Multi-Sector Income Funds |
| Global Macro | Bond HC |
| US Macro | General Domestic Taxable Fixed Income Funds |
| YCharts Categorization | -- |
| YCharts Benchmark | -- |
| Prospectus Objective | Multi-Sector Income Funds |
| Fund Owner Firm Name | UBS Asset Management |
| Broad Asset Class Benchmark Index | |
| ^BBUSATR | 100.0% |
Fundamentals
| General | |
| Distribution Yield | -- |
| Dividend Yield TTM (6-8-26) | 6.80% |
| 30-Day SEC Yield (5-31-26) | 6.13% |
| 7-Day SEC Yield | -- |
| Number of Holdings | 584 |
| Bond | |
| Yield to Maturity (1-31-26) | 6.42% |
| Effective Duration | -- |
| Average Coupon | 6.62% |
| Calculated Average Quality | 5.615 |
| Effective Maturity | 4.727 |
| Nominal Maturity | 4.935 |
| Number of Bond Holdings | 548 |
As of January 31, 2026
Fund Details
Top Portfolio Holders
| Name | % Weight |
|---|---|
| Portfolio A | 5.00% |
| Portfolio B | 3.50% |
| Portfolio C | 2.25% |
Excel Add-In Codes
| Name: =YCI("M:CSOAX", "name") |
| Broad Asset Class: =YCI("M:CSOAX", "broad_asset_class") |
| Broad Category: =YCI("M:CSOAX", "broad_category_group") |
| Prospectus Objective: =YCI("M:CSOAX", "prospectus_objective") |
| To find the codes for any of our securities and financial metrics, see our Complete Excel Reference. |